


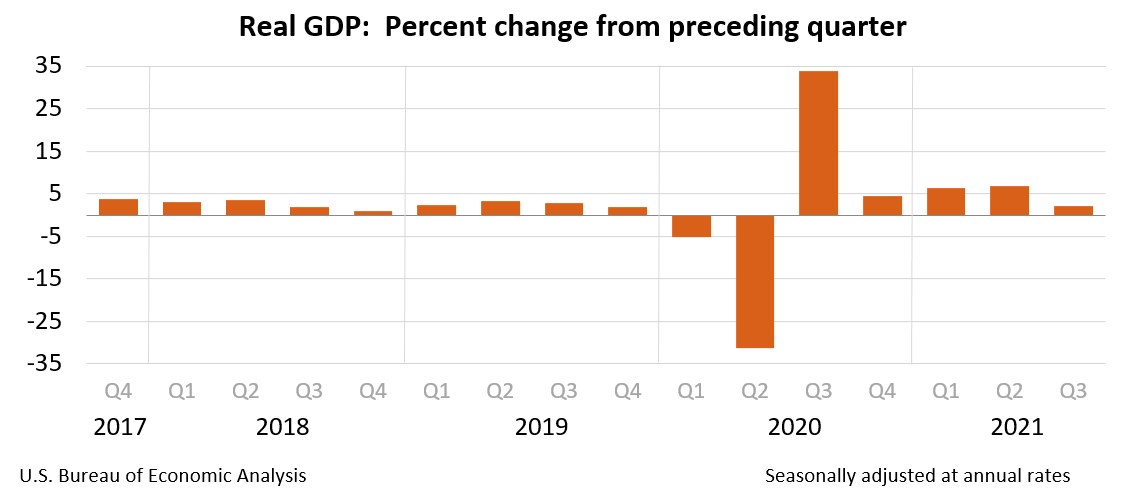
Washington, DC…Real gross domestic product (GDP) increased at an annual rate of 2.0 percent in the third quarter of 2021 (table 1), according to the “advance” estimate released by the Bureau of Economic Analysis. In the second quarter, real GDP increased 6.7 percent.
The GDP estimate released today is based on source data that are incomplete or subject to further revision by the source agency (see “Source Data for the Advance Estimate” on page 3). The “second” estimate for the third quarter, based on more complete data, will be released on November 24, 2021.
The increase in real GDP in the third quarter reflected increases in private inventory investment, personal consumption expenditures (PCE), state and local government spending, and nonresidential fixed investment that were partly offset by decreases in residential fixed investment, federal government spending, and exports. Imports, which are a subtraction in the calculation of GDP, increased (table 2).
The increase in private inventory investment reflected increases in wholesale trade (led by nondurable goods industries) and in retail trade (led by motor vehicles and parts dealers). The increase in PCE reflected an increase in services that was partly offset by a decrease in goods. Within services, increases were widespread with the largest contributions coming from “other” services (mainly international travel), transportation services, and health care. The decrease in goods primarily reflected a decrease in spending on motor vehicles and parts. The increase in state and local government spending was led by employee compensation (notably, education). The increase in nonresidential fixed investment reflected an increase in intellectual property products (led by software) that was partly offset by decreases in structures and equipment.
The decrease in residential fixed investment primarily reflected decreases in improvements and in new single-family structures. The decrease in federal government spending primarily reflected a decrease in nondefense spending on intermediate goods and services after the processing and administration of Paycheck Protection Program loan applications by banks on behalf of the federal government ended in the second quarter. The decrease in exports reflected a decrease in goods that was partly offset by an increase in services. The increase in imports primarily reflected an increase in services (led by travel and transport).
The deceleration in real GDP in the third quarter was more than accounted for by a slowdown in PCE. From the second quarter to the third quarter, spending for goods turned down (led by motor vehicles and parts) and services decelerated (led by food services and accommodations).
Current-dollar GDP increased 7.8 percent at an annual rate, or $432.5 billion, in the third quarter to a level of $23.17 trillion. In the second quarter, GDP increased 13.4 percent, or $702.8 billion (table 1 and table 3). More information on the source data that underlie the estimates is available in the Key Source Data and Assumptions file on BEA’s website.
The price index for gross domestic purchases increased 5.4 percent in the third quarter, compared with an increase of 5.8 percent in the second quarter (table 4). The PCE price index increased 5.3 percent, compared with an increase of 6.5 percent. Excluding food and energy prices, the PCE price index increased 4.5 percent, compared with an increase of 6.1 percent.
Personal Income
Current-dollar personal income increased $47.8 billion in the third quarter, in contrast to a decrease of $1.29 trillion in the second quarter. The increase primarily reflected an increase in compensation that was partly offset by a decrease in government social benefits for unemployment insurance and direct economic impact payments to households established by the Coronavirus Response and Relief Supplemental Appropriations Act and the American Rescue Plan Act (table 8). Additional information on factors impacting personal income can be found in Effects of Selected Federal Pandemic Response Programs on Personal Income.
Disposable personal income decreased $29.4 billion, or 0.7 percent, in the third quarter, compared with a decrease of $1.39 trillion, or 25.7 percent, in the second quarter. Real disposable personal income decreased 5.6 percent, compared with a decrease of 30.2 percent.
Personal saving was $1.60 trillion in the third quarter, compared with $1.90 trillion in the second quarter. The personal saving rate—personal saving as a percentage of disposable personal income—was 8.9 percent in the third quarter, compared with 10.5 percent in the second quarter.
Source Data for the Advance Estimate
Information on the source data and key assumptions used in the advance estimate is provided in a Technical Note that is posted with the news release on BEA’s website. A detailed Key Source Data and Assumptions file is also posted for each release. For information on updates to GDP, see the “Additional Information” section that follows.
* * *
Next release, November 24, 2021 at 8:30 A.M. EST
Gross Domestic Product (Second Estimate)
Corporate Profits (Preliminary Estimate)
Third Quarter 2021
Gross Domestic Product or GDP Stalls in Third Quarter 2021 with Only 2% Annual Rate added by admin on
View all posts by admin →