


Washington, DC…The Producer Price Index for final demand increased 1.4 percent in March, seasonally adjusted, the U.S. Bureau of Labor Statistics reported today. This rise followed advances of 0.9 percent in February and 1.2 percent in January. (See table A.) On an unadjusted basis, final demand prices moved up 11.2 percent for the 12 months ended in March, the largest increase since 12-month data were first calculated in November 2010.
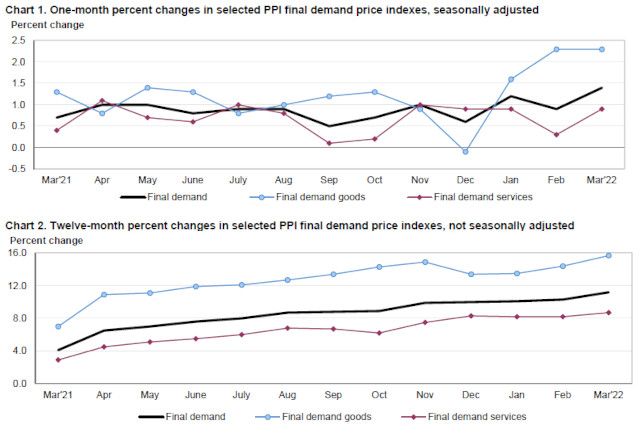
In March, the rise in the index for final demand was led by a 2.3-percent advance in prices for final demand goods. The index for final demand services increased 0.9 percent.
Prices for final demand less foods, energy, and trade services moved up 0.9 percent in March, the largest advance since rising 1.0 percent in January 2021. For the 12 months ended in March, the index for final demand less foods, energy, and trade services increased 7.0 percent.
Final Demand
Final demand goods: The index for final demand goods rose 2.3 percent in March, the same as in February. Over half of the broad-based advance in March can be traced to a 5.7-percent jump in prices for final demand energy. The indexes for final demand goods less foods and energy and for final demand foods also moved higher, 1.1 percent and 2.4 percent, respectively.
Product detail: Leading the March increase in the index for final demand goods, diesel fuel prices jumped 20.4 percent. The indexes for gasoline, fresh and dry vegetables, jet fuel, iron and steel scrap, and electric power also moved higher. In contrast, prices for beef and veal fell 7.3 percent. The indexes for natural gas and for cold rolled steel sheet and strip also declined. (See table 2.)
Final demand services: Prices for final demand services moved up 0.9 percent in March following a 0.3-percent increase in February. Over 40 percent of the March advance can be traced to a 1.2-percent rise in margins for final demand trade services. (Trade indexes measure changes in margins received by wholesalers and retailers.) Prices for final demand transportation and warehousing services and for final demand services less trade, transportation, and warehousing also moved higher, climbing 5.5 percent and 0.3 percent, respectively.
Product detail: A 22.7-percent jump in margins for fuels and lubricants retailing was a major factor in the March advance in prices for final demand services. The indexes for truck transportation of freight; traveler accommodation services; airline passenger services; inpatient care; and hardware, building materials, and supplies retailing also increased. Conversely, prices for securities brokerage, dealing, and investment advice decreased 5.4 percent. The indexes for portfolio management and for automobile retailing (partial) also moved lower.
| Month | Total final demand |
Final demand less foods, energy, and trade |
Final demand goods | Final demand services | Change in final demand from 12 months ago (unadj.) |
Change in final demand less foods, energy, and trade from 12 mo. ago (unadj.) |
||||||
|---|---|---|---|---|---|---|---|---|---|---|---|---|
| Total | Foods | Energy | Less foods and energy |
Total | Trade | Transportation and warehousing |
Other | |||||
|
2021 |
||||||||||||
|
Mar. |
0.7 | 0.6 | 1.3 | 0.6 | 3.8 | 0.9 | 0.4 | 0.2 | 1.3 | 0.5 | 4.1 | 3.1 |
|
Apr. |
1.0 | 0.8 | 0.8 | 1.4 | -0.3 | 1.0 | 1.1 | 2.1 | 3.1 | 0.3 | 6.5 | 4.8 |
|
May |
1.0 | 0.5 | 1.4 | 2.5 | 1.5 | 1.1 | 0.7 | 1.8 | 0.2 | 0.2 | 7.0 | 5.3 |
|
June |
0.8 | 0.6 | 1.3 | 0.8 | 2.9 | 1.0 | 0.6 | 0.8 | 1.4 | 0.4 | 7.6 | 5.6 |
|
July |
0.9 | 0.7 | 0.8 | -0.9 | 2.2 | 0.8 | 1.0 | 1.7 | 2.5 | 0.5 | 8.0 | 6.0 |
|
Aug. |
0.9 | 0.4 | 1.0 | 2.1 | 1.3 | 0.6 | 0.8 | 2.1 | 0.8 | 0.2 | 8.7 | 6.2 |
|
Sept. |
0.5 | 0.3 | 1.2 | 2.1 | 2.5 | 0.6 | 0.1 | 0.0 | -1.0 | 0.3 | 8.8 | 6.1 |
|
Oct. |
0.7 | 0.4 | 1.3 | -0.1 | 5.0 | 0.7 | 0.2 | 0.5 | 1.1 | -0.1 | 8.9 | 6.2 |
|
Nov.(1) |
1.0 | 0.8 | 0.9 | 1.3 | 0.9 | 0.8 | 1.0 | 1.3 | 2.8 | 0.6 | 9.9 | 7.0 |
|
Dec.(1) |
0.6 | 0.4 | -0.1 | -0.2 | -1.4 | 0.4 | 0.9 | 1.9 | 1.5 | 0.3 | 10.0 | 7.0 |
|
2022 |
||||||||||||
|
Jan.(1) |
1.2 | 0.8 | 1.6 | 1.8 | 4.1 | 0.8 | 0.9 | 1.4 | 0.0 | 0.8 | 10.1 | 6.9 |
|
Feb.(1) |
0.9 | 0.2 | 2.3 | 2.1 | 7.5 | 0.8 | 0.3 | 1.1 | 1.6 | -0.3 | 10.3 | 6.7 |
|
Mar. |
1.4 | 0.9 | 2.3 | 2.4 | 5.7 | 1.1 | 0.9 | 1.2 | 5.5 | 0.3 | 11.2 | 7.0 |
|
Footnotes |
||||||||||||
Intermediate Demand by Commodity Type

Within intermediate demand in March, prices for processed goods rose 2.1 percent, the index for
unprocessed goods declined 1.4 percent, and prices for services advanced 0.6 percent. (See tables B
and C.)

Processed goods for intermediate demand: The index for processed goods for intermediate
demand increased 2.1 percent in March after rising 1.5 percent in February. Over 60 percent of the
broad-based advance in March can be attributed to prices for processed energy goods, which moved
up 6.4 percent. The indexes for processed materials less foods and energy and for processed foods
and feeds also increased, 0.8 percent and 2.0 percent, respectively. For the 12 months ended in
March, prices for processed goods for intermediate demand jumped 21.7 percent.

Product detail: A major factor in the March increase in prices for processed goods for intermediate
demand was the index for jet fuel, which jumped 23.0 percent. Prices for diesel fuel, industrial
chemicals, nonferrous metals, gasoline, and prepared animal feeds also advanced. In contrast, the
index for utility natural gas fell 8.6 percent. Prices for cold rolled steel sheet and strip and for beef
and veal also declined.

Unprocessed goods for intermediate demand: Prices for unprocessed goods for intermediate
demand decreased 1.4 percent in March after increasing 13.0 percent in February. The decline in
March can be traced to the index for unprocessed energy materials, which fell 11.2 percent.
Conversely, prices for unprocessed nonfood materials less energy and for unprocessed foodstuffs and
feedstuffs moved higher, 9.5 percent and 5.2 percent, respectively. For the 12 months ended in
March, the index for unprocessed goods for intermediate demand jumped 40.8 percent.

Product detail: Leading the March decline in the index for unprocessed goods for intermediate
demand, natural gas prices dropped 30.1 percent. The indexes for raw milk, slaughter barrows and
gilts, slaughter steers and heifers, hides and skins, and raw cotton also moved lower. In contrast,
prices for iron and steel scrap jumped 27.6 percent. The indexes for crude petroleum and for corn
also increased.
| Month | Processed goods for intermediate demand | Unprocessed goods for intermediate demand | ||||||||
|---|---|---|---|---|---|---|---|---|---|---|
| Total | Foods and feeds |
Energy goods |
Less foods and energy |
Total, change from 12 months ago (unadj.) |
Total | Foodstuffs and feedstuffs |
Energy materials |
Nonfood materials less energy |
Total, change from 12 months ago (unadj.) |
|
|
2021 |
||||||||||
|
Mar. |
3.4 | 1.4 | 7.3 | 2.7 | 12.4 | -4.0 | 1.8 | -13.4 | 1.9 | 34.8 |
|
Apr. |
2.1 | 2.4 | -1.8 | 3.0 | 18.7 | 0.8 | 5.6 | -4.9 | 1.9 | 59.2 |
|
May |
2.8 | 2.6 | 3.3 | 2.7 | 22.3 | 7.9 | 6.8 | 8.3 | 8.8 | 57.8 |
|
June |
1.7 | 1.6 | 0.8 | 2.0 | 23.0 | 2.1 | -0.5 | 5.6 | 1.0 | 52.9 |
|
July |
1.6 | -0.6 | 3.4 | 1.4 | 23.1 | 3.2 | -1.0 | 9.7 | 0.6 | 56.0 |
|
Aug. |
1.0 | 1.5 | 0.0 | 1.1 | 23.0 | 1.4 | 3.0 | 0.2 | 1.4 | 52.5 |
|
Sept. |
1.2 | 1.5 | 2.1 | 0.9 | 23.8 | 2.8 | 0.8 | 8.0 | -1.8 | 48.5 |
|
Oct. |
2.4 | -0.4 | 6.7 | 1.6 | 25.7 | 6.0 | -2.2 | 17.7 | -1.5 | 55.5 |
|
Nov.(1) |
1.5 | 0.1 | 2.5 | 1.4 | 26.6 | 2.3 | 1.3 | 2.3 | 3.4 | 49.6 |
|
Dec.(1) |
-0.1 | 0.1 | -2.7 | 0.6 | 24.4 | -4.9 | 3.8 | -12.3 | -1.8 | 39.9 |
|
2022 |
||||||||||
|
Jan.(1) |
2.1 | 2.6 | 4.6 | 1.4 | 24.7 | 2.7 | 2.7 | 4.2 | -0.3 | 35.8 |
|
Feb.(1) |
1.5 | 2.2 | 5.9 | 0.3 | 23.3 | 13.0 | 5.6 | 25.8 | 1.4 | 36.8 |
|
Mar. |
2.1 | 2.0 | 6.4 | 0.8 | 21.7 | -1.4 | 5.2 | -11.2 | 9.5 | 40.8 |
|
Footnotes |
||||||||||
Services for intermediate demand: The index for services for intermediate demand increased 0.6
percent in March after no change in February. Seventy percent of the March advance can be
attributed to a 1.9-percent rise in margins for trade services for intermediate demand. The index for
transportation and warehousing services for intermediate demand moved up 2.0 percent. Conversely,
prices for services less trade, transportation, and warehousing for intermediate demand edged down
0.1 percent. For the 12 months ended in March, the index for services for intermediate demand
jumped 7.4 percent.

Product detail: A major factor in the March increase in prices for services for intermediate demand
was a 6.7-percent jump in margins for paper and plastics products wholesaling. The indexes for truck
transportation of freight; fuels and lubricants retailing; hardware, building materials, and supplies
retailing; airline passenger services; and traveler accommodation services also moved higher. In
contrast, prices for securities brokerage, dealing, and investment advice fell 5.4 percent. The indexes
for chemicals and allied products wholesaling and for arrangement of freight and cargo transportation
also declined.
| Month | Services for intermediate demand | ||||
|---|---|---|---|---|---|
| Total | Trade | Transportation and warehousing |
Other | Total, change from 12 months ago (unadj.) |
|
|
2021 |
|||||
|
Mar. |
0.6 | 1.2 | 0.9 | 0.5 | 4.3 |
|
Apr. |
1.3 | 2.5 | 2.2 | 0.6 | 7.3 |
|
May |
0.6 | 2.2 | 0.8 | 0.1 | 8.4 |
|
June |
1.2 | 2.5 | 2.0 | 0.6 | 9.3 |
|
July |
0.6 | 1.1 | 0.7 | 0.4 | 9.5 |
|
Aug. |
0.4 | 1.9 | 0.8 | -0.2 | 9.0 |
|
Sept. |
0.3 | -1.2 | 2.5 | 0.4 | 8.2 |
|
Oct. |
0.0 | 0.6 | 0.5 | -0.3 | 7.4 |
|
Nov.(1) |
0.6 | -0.6 | 1.0 | 0.9 | 8.1 |
|
Dec.(1) |
0.8 | 1.4 | 1.5 | 0.5 | 8.3 |
|
2022 |
|||||
|
Jan.(1) |
0.8 | 1.4 | 0.6 | 0.6 | 7.9 |
|
Feb.(1) |
0.0 | 0.7 | 0.3 | -0.3 | 7.5 |
|
Mar. |
0.6 | 1.9 | 2.0 | -0.1 | 7.4 |
|
Footnotes |
|||||
Intermediate Demand by Production Flow

Stage 4 intermediate demand: Prices for stage 4 intermediate demand advanced 0.8 percent in
March following a 0.5-percent rise in February. In March, the index for total goods inputs to stage 4
intermediate demand increased 1.4 percent, and prices for total services inputs moved up 0.2 percent.
Advances in the indexes for diesel fuel, grains, paper and plastics products wholesaling, truck
transportation of freight, nonferrous metals, and gasoline outweighed decreases in prices for
securities brokerage, dealing, and investment advice; utility natural gas; and portfolio management.
For the 12 months ended in March, the index for stage 4 intermediate demand jumped 11.8 percent.

Stage 3 intermediate demand: The index for stage 3 intermediate demand rose 2.3 percent in
March, the largest increase since advancing 2.4 percent in May 2021. In March, prices for total goods
inputs to stage 3 intermediate demand moved up 3.6 percent, and the index for total services inputs
rose 0.8 percent. Advances in prices for diesel fuel, slaughter poultry, grains, jet fuel, truck
transportation of freight, and industrial chemicals outweighed decreases in the indexes for raw milk,
cold rolled steel sheet and strip, and deposit services (partial). For the 12 months ended in March,
prices for stage 3 intermediate demand jumped 19.0 percent.

Stage 2 intermediate demand: The index for stage 2 intermediate demand moved down 1.2 percent
in March after increasing 5.6 percent in February. In March, prices for total goods inputs to stage 2
intermediate demand declined 3.1 percent. Conversely, the index for total services inputs rose 0.8
percent. Falling prices for natural gas; deposit services (partial); utility natural gas; cold rolled steel
sheet and strip; securities brokerage, dealing, and investment advice; and arrangement of freight and
cargo transportation outweighed advances in the indexes for fuels and lubricants retailing, crude
petroleum, and iron and steel scrap. For the 12 months ended in March, prices for stage 2
intermediate demand jumped 20.5 percent.

Stage 1 intermediate demand: The index for stage 1 intermediate demand increased 2.1 percent in
March, the largest rise since advancing 2.6 percent in May 2021. In March, prices for total goods
inputs to stage 1 intermediate demand moved up 3.0 percent, and the index for total services inputs
climbed 1.1 percent. Advances in the indexes for diesel fuel; grains; iron and steel scrap; traveler
accommodation services; industrial chemicals; and hardware, building materials, and supplies
retailing outweighed decreasing prices for utility natural gas; securities brokerage, dealing, and
investment advice; and cold rolled steel sheet and strip. For the 12 months ended in March, the index
for stage 1 intermediate demand jumped 16.4 percent.
| Month | Stage 4 intermediate demand |
Stage 3 intermediate demand |
Stage 2 intermediate demand |
Stage 1 intermediate demand |
||||||||
|---|---|---|---|---|---|---|---|---|---|---|---|---|
| Total | Goods inputs |
Services inputs |
Total | Goods inputs |
Services inputs |
Total | Goods inputs |
Services inputs |
Total | Goods inputs |
Services inputs |
|
|
2021 |
||||||||||||
|
Mar. |
1.4 | 1.9 | 0.7 | 2.4 | 4.4 | 0.6 | -1.5 | -3.9 | 0.6 | 2.2 | 3.7 | 0.9 |
|
Apr. |
1.4 | 1.7 | 1.2 | 2.7 | 4.3 | 1.3 | 0.4 | -0.5 | 1.2 | 1.7 | 1.9 | 1.6 |
|
May |
1.2 | 2.2 | 0.5 | 2.4 | 3.8 | 0.9 | 3.0 | 6.3 | 0.3 | 2.6 | 3.9 | 1.3 |
|
June |
1.3 | 1.5 | 1.1 | 1.6 | 1.8 | 1.3 | 2.1 | 3.1 | 1.2 | 1.5 | 1.6 | 1.5 |
|
July |
1.0 | 1.0 | 1.0 | 1.0 | 1.6 | 0.4 | 2.3 | 4.3 | 0.6 | 1.4 | 2.1 | 0.8 |
|
Aug. |
0.7 | 0.9 | 0.6 | 1.0 | 1.6 | 0.4 | 0.7 | 0.9 | 0.5 | 0.8 | 1.3 | 0.5 |
|
Sept. |
0.4 | 0.8 | 0.1 | 1.1 | 1.2 | 1.0 | 2.2 | 3.6 | 0.9 | 0.2 | 0.7 | -0.3 |
|
Oct. |
0.6 | 1.3 | 0.0 | 1.0 | 1.9 | 0.2 | 3.7 | 7.9 | -0.1 | 1.1 | 2.5 | -0.3 |
|
Nov.(1) |
1.1 | 1.5 | 0.7 | 0.8 | 1.2 | 0.4 | 1.2 | 1.7 | 0.7 | 1.3 | 2.0 | 0.5 |
|
Dec.(1) |
0.7 | 0.6 | 0.8 | 0.8 | 0.7 | 0.8 | -2.2 | -5.7 | 1.2 | 0.4 | 0.0 | 0.8 |
|
2022 |
||||||||||||
|
Jan.(1) |
1.5 | 2.0 | 1.1 | 1.7 | 2.6 | 0.7 | 1.3 | 2.5 | 0.1 | 1.3 | 1.7 | 0.9 |
|
Feb.(1) |
0.5 | 1.2 | -0.3 | 1.4 | 2.6 | 0.0 | 5.6 | 11.4 | 0.1 | 0.9 | 1.6 | 0.0 |
|
Mar. |
0.8 | 1.4 | 0.2 | 2.3 | 3.6 | 0.8 | -1.2 | -3.1 | 0.8 | 2.1 | 3.0 | 1.1 |
|
Footnotes |
||||||||||||
________________
The Producer Price Index for April 2022 is scheduled to be released on Thursday, May 12, 2022,
at 8:30 a.m. (ET).
Inflation Drives Producer Price Index up 11.2%! Even Worse than Consumer Inflation! added by admin on
View all posts by admin →