


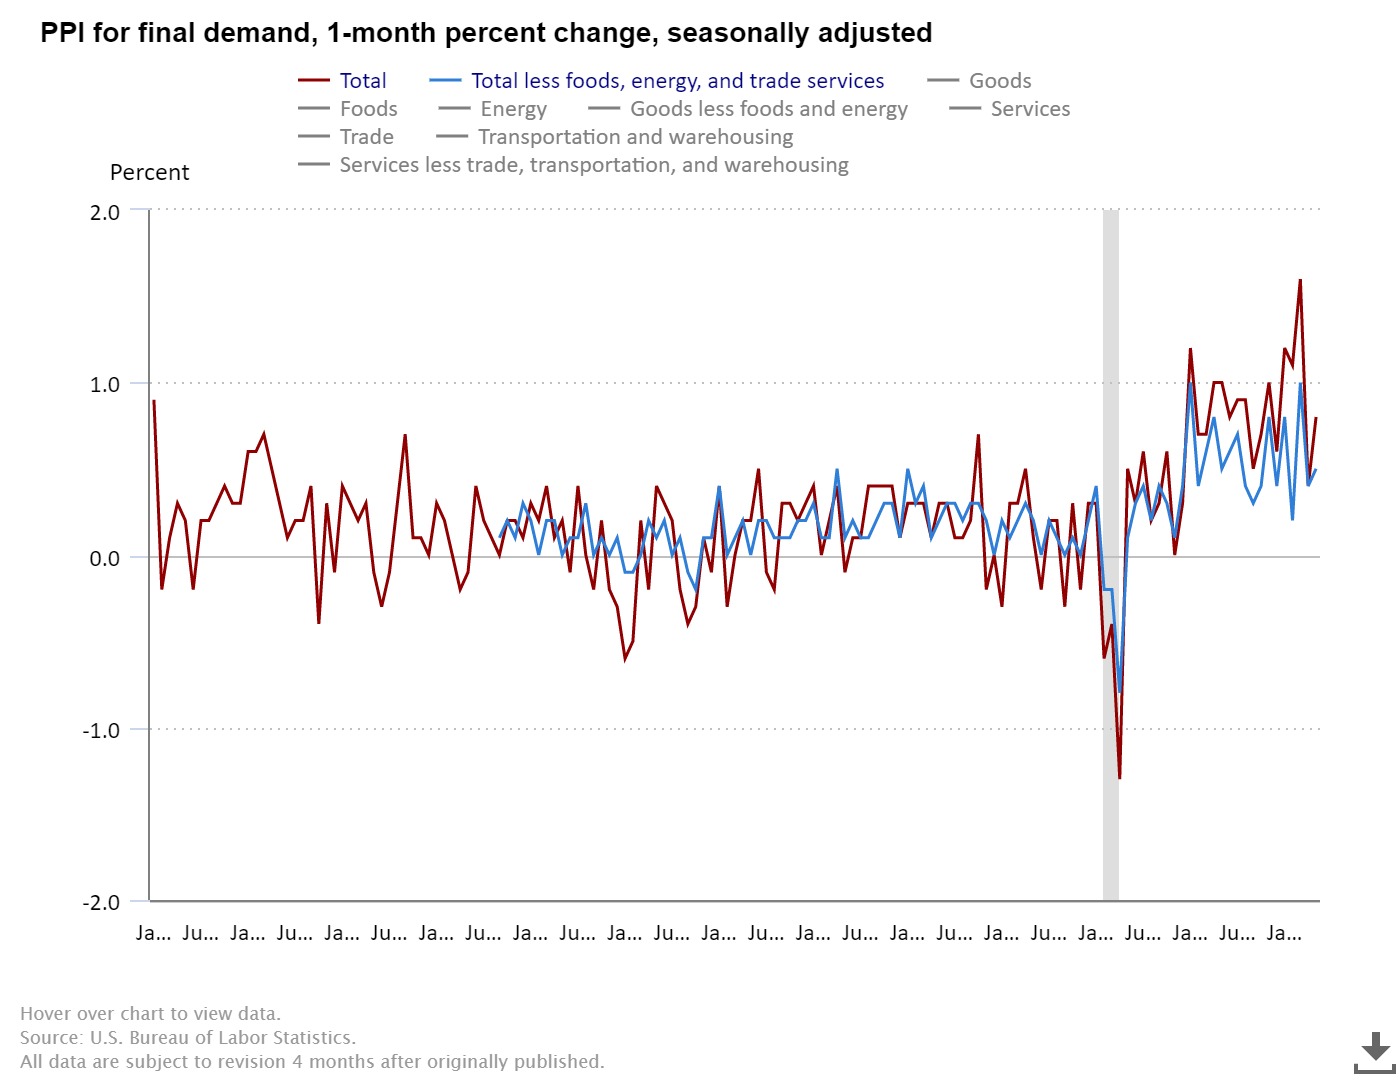
Washington, DC..The Producer Price Index for final demand increased 0.8 percent in May, seasonally adjusted, the
U.S. Bureau of Labor Statistics reported today. This rise followed advances of 0.4 percent in April and 1.6 percent in March. (See table A.) On an unadjusted basis, final demand prices moved up 10.8 percent for the 12 months ended in May.
In May, nearly two-thirds of the rise in the index for final demand was due to a 1.4-percent
advance in prices for final demand goods. The index for final demand services increased 0.4
percent.
Prices for final demand less foods, energy, and trade services moved up 0.5 percent in May after
increasing 0.4 percent in April. For the 12 months ended in May, the index for final demand less
foods, energy, and trade services rose 6.8 percent.
Final Demand
Final demand goods: The index for final demand goods moved up 1.4 percent in May, the fifth
consecutive rise. Over 70 percent of the increase in May can be traced to a 5.0-percent advance in
prices for final demand energy. The index for final demand goods less foods and energy moved up
0.7 percent, while prices for final demand foods were unchanged.
Product detail: Forty percent of the May increase in prices for final demand goods can be attributed
to an 8.4-percent advance in the index for gasoline. Prices for jet fuel, residential natural gas, steel
mill products, diesel fuel, and processed young chickens also moved higher. Conversely, the index
for beef and veal fell 9.5 percent. Prices for iron and steel scrap and for commercial electric power
also decreased. (See table 2.)
Final demand services: The index for final demand services moved up 0.4 percent in May following
a 0.2-percent decrease in April. Over half of the broad-based advance can be traced to a 2.9-percent
rise in prices for final demand transportation and warehousing services. The indexes for final demand
trade services and for final demand services less trade, transportation, and warehousing also moved
higher, 0.4 percent and 0.1 percent, respectively. (Trade indexes measure changes in margins
received by wholesalers and retailers.)
Product detail: Nearly 30 percent of the May increase in the index for final demand services can be
attributed to prices for truck transportation of freight, which rose 2.9 percent. The indexes for
services related to securities brokerage and dealing (partial), machinery and equipment wholesaling,
chemicals and allied products wholesaling, automobiles and automobile parts retailing, and
transportation of passengers (partial) also advanced. In contrast, margins for fuels and lubricants
retailing declined 21.7 percent. The indexes for portfolio management and for guestroom rental also
moved lower.
| Month | Total final demand |
Final demand less foods, energy, and trade |
Final demand goods | Final demand services | Change in final demand from 12 months ago (unadj.) |
Change in final demand less foods, energy, and trade from 12 mo. ago (unadj.) |
||||||
|---|---|---|---|---|---|---|---|---|---|---|---|---|
| Total | Foods | Energy | Less foods and energy |
Total | Trade | Transportation and warehousing |
Other | |||||
|
2021 |
||||||||||||
|
May |
1.0 | 0.5 | 1.4 | 2.5 | 1.5 | 1.1 | 0.7 | 1.8 | 0.2 | 0.2 | 7.0 | 5.3 |
|
June |
0.8 | 0.6 | 1.3 | 0.8 | 2.9 | 1.0 | 0.6 | 0.8 | 1.4 | 0.4 | 7.6 | 5.6 |
|
July |
0.9 | 0.7 | 0.8 | -0.9 | 2.2 | 0.8 | 1.0 | 1.7 | 2.5 | 0.5 | 8.0 | 6.0 |
|
Aug. |
0.9 | 0.4 | 1.0 | 2.1 | 1.3 | 0.6 | 0.8 | 2.1 | 0.8 | 0.2 | 8.7 | 6.2 |
|
Sept. |
0.5 | 0.3 | 1.2 | 2.1 | 2.5 | 0.6 | 0.1 | 0.0 | -1.0 | 0.3 | 8.8 | 6.1 |
|
Oct. |
0.7 | 0.4 | 1.3 | -0.1 | 5.0 | 0.7 | 0.2 | 0.5 | 1.1 | -0.1 | 8.9 | 6.2 |
|
Nov. |
1.0 | 0.8 | 0.9 | 1.3 | 0.9 | 0.8 | 1.0 | 1.3 | 2.8 | 0.6 | 9.9 | 7.0 |
|
Dec. |
0.6 | 0.4 | -0.1 | -0.2 | -1.4 | 0.4 | 0.9 | 1.9 | 1.6 | 0.3 | 10.0 | 7.0 |
|
2022 |
||||||||||||
|
Jan.(1) |
1.2 | 0.8 | 1.6 | 1.8 | 4.1 | 0.8 | 0.9 | 1.3 | 0.0 | 0.8 | 10.1 | 6.9 |
|
Feb.(1) |
1.1 | 0.2 | 2.2 | 1.9 | 7.2 | 0.8 | 0.5 | 1.7 | 2.0 | -0.3 | 10.4 | 6.8 |
|
Mar.(1) |
1.6 | 1.0 | 2.4 | 2.4 | 6.5 | 1.1 | 1.2 | 1.8 | 5.7 | 0.4 | 11.5 | 7.1 |
|
Apr.(1) |
0.4 | 0.4 | 1.3 | 1.4 | 1.6 | 1.1 | -0.2 | -0.6 | 2.0 | -0.2 | 10.9 | 6.8 |
|
May |
0.8 | 0.5 | 1.4 | 0.0 | 5.0 | 0.7 | 0.4 | 0.4 | 2.9 | 0.1 | 10.8 | 6.8 |
|
Footnotes |
||||||||||||
Intermediate Demand by Commodity Type

Within intermediate demand in May, prices for processed goods advanced 2.3 percent, the index for
unprocessed goods increased 6.3 percent, and prices for services rose 0.6 percent. (See tables B and
C.)

Processed goods for intermediate demand: The index for processed goods for intermediate
demand increased 2.3 percent in May, the fifth consecutive advance. Over half of the broad-based
increase in May can be traced to a 1.7-percent rise in prices for processed materials less foods and
energy. The indexes for processed energy goods and for processed foods and feeds also moved
higher, 4.6 percent and 0.9 percent, respectively. For the 12 months ended in May, prices for
processed goods for intermediate demand jumped 21.6 percent.

Product detail: One-quarter of the May increase in the index for processed goods for intermediate
demand can be attributed to a 10.7-percent rise in prices for steel mill products. The indexes for
utility natural gas, gasoline, diesel fuel, jet fuel, and ethanol also advanced. Conversely, prices for
commercial electric power declined 1.9 percent. The indexes for primary nonferrous metals and for
beef and veal also moved lower.

Unprocessed goods for intermediate demand: The index for unprocessed goods for intermediate
demand climbed 6.3 percent in May, the fifth consecutive advance. Leading the May increase, prices
for unprocessed energy materials rose 16.3 percent. The index for unprocessed foodstuffs and
feedstuffs also moved higher, advancing 0.9 percent. In contrast, prices for unprocessed nonfood
materials less energy fell 4.2 percent. For the 12 months ended in May, the index for unprocessed
goods for intermediate demand surged 48.5 percent.

Product detail: A major factor in the May increase in prices for unprocessed goods for intermediate
demand was the index for natural gas, which jumped 39.7 percent. Prices for raw milk, coal,
slaughter steers and heifers, hay and hayseeds, and raw cotton also rose. Conversely, the index for
iron and steel scrap dropped 11.8 percent. Prices for crude petroleum and for slaughter hogs also
decreased.
| Month | Processed goods for intermediate demand | Unprocessed goods for intermediate demand | ||||||||
|---|---|---|---|---|---|---|---|---|---|---|
| Total | Foods and feeds |
Energy goods |
Less foods and energy |
Total, change from 12 months ago (unadj.) |
Total | Foodstuffs and feedstuffs |
Energy materials |
Nonfood materials less energy |
Total, change from 12 months ago (unadj.) |
|
|
2021 |
||||||||||
|
May |
2.8 | 2.6 | 3.3 | 2.7 | 22.3 | 7.9 | 6.8 | 8.3 | 8.8 | 57.8 |
|
June |
1.7 | 1.6 | 0.8 | 2.0 | 23.0 | 2.1 | -0.5 | 5.6 | 1.0 | 52.9 |
|
July |
1.6 | -0.6 | 3.4 | 1.4 | 23.1 | 3.2 | -1.0 | 9.7 | 0.6 | 56.0 |
|
Aug. |
1.0 | 1.5 | 0.0 | 1.1 | 23.0 | 1.4 | 3.0 | 0.2 | 1.4 | 52.5 |
|
Sept. |
1.2 | 1.5 | 2.1 | 0.9 | 23.8 | 2.8 | 0.8 | 8.0 | -1.8 | 48.5 |
|
Oct. |
2.4 | -0.4 | 6.7 | 1.6 | 25.7 | 6.0 | -2.2 | 17.7 | -1.5 | 55.5 |
|
Nov. |
1.5 | 0.1 | 2.5 | 1.4 | 26.6 | 2.3 | 1.3 | 2.3 | 3.4 | 49.6 |
|
Dec. |
-0.1 | 0.1 | -2.7 | 0.6 | 24.4 | -4.8 | 3.8 | -12.1 | -1.8 | 40.0 |
|
2022 |
||||||||||
|
Jan.(1) |
2.2 | 2.6 | 4.7 | 1.5 | 24.8 | 3.1 | 2.9 | 4.2 | 1.1 | 36.4 |
|
Feb.(1) |
1.5 | 2.1 | 5.8 | 0.4 | 23.3 | 10.0 | 5.4 | 18.6 | 1.5 | 33.7 |
|
Mar.(1) |
2.3 | 2.1 | 7.2 | 0.9 | 22.1 | 2.7 | 7.6 | -4.4 | 9.2 | 43.3 |
|
Apr.(1) |
2.0 | 3.0 | 4.5 | 1.1 | 21.9 | 6.1 | 4.3 | 10.4 | 1.7 | 50.8 |
|
May |
2.3 | 0.9 | 4.6 | 1.7 | 21.6 | 6.3 | 0.9 | 16.3 | -4.2 | 48.5 |
|
Footnotes |
||||||||||
Services for intermediate demand: The index for services for intermediate demand moved up 0.6
percent in May, the seventh consecutive increase. Over half of the broad-based advance in May is
attributable to a 0.5-percent rise in prices for services less trade, transportation, and warehousing for
intermediate demand. The indexes for trade services for intermediate demand and for transportation
and warehousing services for intermediate demand also moved higher, 0.6 percent and 1.0 percent,
respectively. For the 12 months ended in May, prices for services for intermediate demand advanced
7.7 percent.

Product detail: Over one-third of the May rise in the index for services for intermediate demand can
be traced to a 39.1-percent jump in prices for services related to securities brokerage and dealing
(partial). The indexes for loan services (partial); machinery and equipment parts and supplies
wholesaling; chemicals and allied products wholesaling; truck transportation of freight; and metals,
minerals, and ores wholesaling also increased. In contrast, margins for fuels and lubricants retailing
fell 21.7 percent. Prices for arrangement of freight and cargo transportation and for portfolio
management also declined.
| Month | Services for intermediate demand | ||||
|---|---|---|---|---|---|
| Total | Trade | Transportation and warehousing |
Other | Total, change from 12 months ago (unadj.) |
|
|
2021 |
|||||
|
May |
0.6 | 2.2 | 0.8 | 0.1 | 8.4 |
|
June |
1.2 | 2.5 | 2.0 | 0.6 | 9.3 |
|
July |
0.6 | 1.1 | 0.7 | 0.4 | 9.5 |
|
Aug. |
0.4 | 1.9 | 0.8 | -0.2 | 9.0 |
|
Sept. |
0.3 | -1.2 | 2.5 | 0.4 | 8.2 |
|
Oct. |
0.0 | 0.6 | 0.5 | -0.3 | 7.4 |
|
Nov. |
0.6 | -0.6 | 1.0 | 0.9 | 8.1 |
|
Dec. |
0.8 | 1.5 | 1.6 | 0.5 | 8.3 |
|
2022 |
|||||
|
Jan.(1) |
0.8 | 1.4 | 0.6 | 0.6 | 7.9 |
|
Feb.(1) |
0.2 | 1.3 | 0.5 | -0.2 | 7.7 |
|
Mar.(1) |
1.2 | 4.0 | 2.2 | 0.0 | 8.3 |
|
Apr.(1) |
0.7 | 0.3 | 2.0 | 0.6 | 7.8 |
|
May |
0.6 | 0.6 | 1.0 | 0.5 | 7.7 |
|
Footnotes |
|||||
Intermediate Demand by Production Flow

Stage 4 intermediate demand: Prices for stage 4 intermediate demand climbed 1.0 percent in May
following a 0.8-percent rise in April. In May, the index for total goods inputs to stage 4 intermediate
demand increased 1.3 percent, and prices for total services inputs moved up 0.7 percent. (See table
D.) Advances in the indexes for steel mill products, services related to securities brokerage and
dealing (partial), machinery and equipment parts and supplies wholesaling, gasoline, utility natural
gas, and chemicals and allied products wholesaling outweighed decreases in prices for portfolio
management; securities brokerage, dealing, and investment advice; and beef and veal. For the 12
months ended in May, the index for stage 4 intermediate demand jumped 11.5 percent.

Stage 3 intermediate demand: Prices for stage 3 intermediate demand moved up 1.8 percent in May
after rising 2.5 percent in April. In May, the index for total goods inputs to stage 3 intermediate
demand climbed 2.9 percent, and prices for total services inputs advanced 0.6 percent. Increases in
the indexes for steel mill products; jet fuel; raw milk; diesel fuel; asphalt; and metals, minerals, and
ores wholesaling outweighed falling prices for slaughter hogs, arrangement of freight and cargo
transportation, and slaughter cows and bulls. For the 12 months ended in May, the index for stage 3
intermediate demand jumped 19.3 percent.

Stage 2 intermediate demand: The index for stage 2 intermediate demand rose 3.9 percent in May,
the fifth straight advance. In May, prices for total goods inputs to stage 2 intermediate demand
jumped 7.5 percent, while the index for total services inputs was unchanged. Increases in prices for
gas fuels, ethanol, loan services (partial), steel mill products, coal, and water transportation of freight
outweighed declines in the indexes for fuels and lubricants retailing, iron and steel scrap, and crude
petroleum. For the 12 months ended in May, prices for stage 2 intermediate demand surged 25.6
percent, the largest rise since a 26.6-percent advance for the 12 months ended November 2021.

Stage 1 intermediate demand: The index for stage 1 intermediate demand moved up 1.6 percent in
May, the same as in April. In May, prices for total goods inputs to stage 1 intermediate demand
increased 2.3 percent, and the index for total services inputs rose 0.9 percent. Higher prices for steel
mill products, utility natural gas, services related to securities brokerage and dealing (partial), diesel
fuel, ethanol, and gasoline outweighed decreases in the indexes for iron and steel scrap; hardware,
building materials, and supplies retailing; and guestroom rental. For the 12 months ended in May,
prices for stage 1 intermediate demand climbed 16.1 percent.
| Month | Stage 4 intermediate demand |
Stage 3 intermediate demand |
Stage 2 intermediate demand |
Stage 1 intermediate demand |
||||||||
|---|---|---|---|---|---|---|---|---|---|---|---|---|
| Total | Goods inputs |
Services inputs |
Total | Goods inputs |
Services inputs |
Total | Goods inputs |
Services inputs |
Total | Goods inputs |
Services inputs |
|
|
2021 |
||||||||||||
|
May |
1.2 | 2.2 | 0.5 | 2.4 | 3.8 | 0.9 | 3.0 | 6.3 | 0.3 | 2.6 | 3.9 | 1.3 |
|
June |
1.3 | 1.5 | 1.1 | 1.6 | 1.8 | 1.3 | 2.1 | 3.1 | 1.2 | 1.5 | 1.6 | 1.5 |
|
July |
1.0 | 1.0 | 1.0 | 1.0 | 1.6 | 0.4 | 2.3 | 4.3 | 0.6 | 1.4 | 2.1 | 0.8 |
|
Aug. |
0.7 | 0.9 | 0.6 | 1.0 | 1.6 | 0.4 | 0.7 | 0.9 | 0.5 | 0.8 | 1.3 | 0.5 |
|
Sept. |
0.4 | 0.8 | 0.1 | 1.1 | 1.2 | 1.0 | 2.2 | 3.6 | 0.9 | 0.2 | 0.7 | -0.3 |
|
Oct. |
0.6 | 1.3 | 0.0 | 1.0 | 1.9 | 0.2 | 3.7 | 7.9 | -0.1 | 1.1 | 2.5 | -0.3 |
|
Nov. |
1.1 | 1.5 | 0.7 | 0.8 | 1.2 | 0.4 | 1.2 | 1.7 | 0.7 | 1.3 | 2.0 | 0.5 |
|
Dec. |
0.7 | 0.5 | 0.8 | 0.8 | 0.7 | 0.9 | -2.2 | -5.6 | 1.2 | 0.4 | 0.0 | 0.8 |
|
2022 |
||||||||||||
|
Jan.(1) |
1.5 | 2.1 | 1.0 | 1.6 | 2.6 | 0.7 | 1.4 | 2.7 | 0.1 | 1.4 | 1.8 | 1.0 |
|
Feb.(1) |
0.6 | 1.2 | 0.0 | 1.4 | 2.6 | 0.1 | 4.4 | 8.6 | 0.3 | 1.0 | 1.6 | 0.2 |
|
Mar.(1) |
1.1 | 1.6 | 0.7 | 3.1 | 4.6 | 1.5 | 0.7 | 0.1 | 1.3 | 2.7 | 3.3 | 2.1 |
|
Apr.(1) |
0.8 | 1.2 | 0.5 | 2.5 | 3.7 | 1.2 | 3.0 | 5.2 | 0.8 | 1.6 | 2.4 | 0.6 |
|
May |
1.0 | 1.3 | 0.7 | 1.8 | 2.9 | 0.6 | 3.9 | 7.5 | 0.0 | 1.6 | 2.3 | 0.9 |
|
Footnotes |
||||||||||||
________________
The Producer Price Index for June 2022 is scheduled to be released on Thursday, July 14, 2022,
at 8:30 a.m. (ET).
More Inflation Woes as Producer Prices Index Rising at 10.8% added by admin on
View all posts by admin →