


Washington, DC…Total nonfarm payroll employment increased by 263,000 in November, and the unemployment rate was unchanged at 3.7 percent, the U.S. Bureau of Labor Statistics reported today. Notable job gains occurred in leisure and hospitality, health care, and government. Employment declined in retail trade and in transportation and warehousing.
This news release presents statistics from two monthly surveys. The household survey measures labor force status, including unemployment, by demographic characteristics. The establishment survey measures nonfarm employment, hours, and earnings by industry. For more information about the concepts and statistical methodology used in these two surveys, see the Technical Note.
Household Survey Data
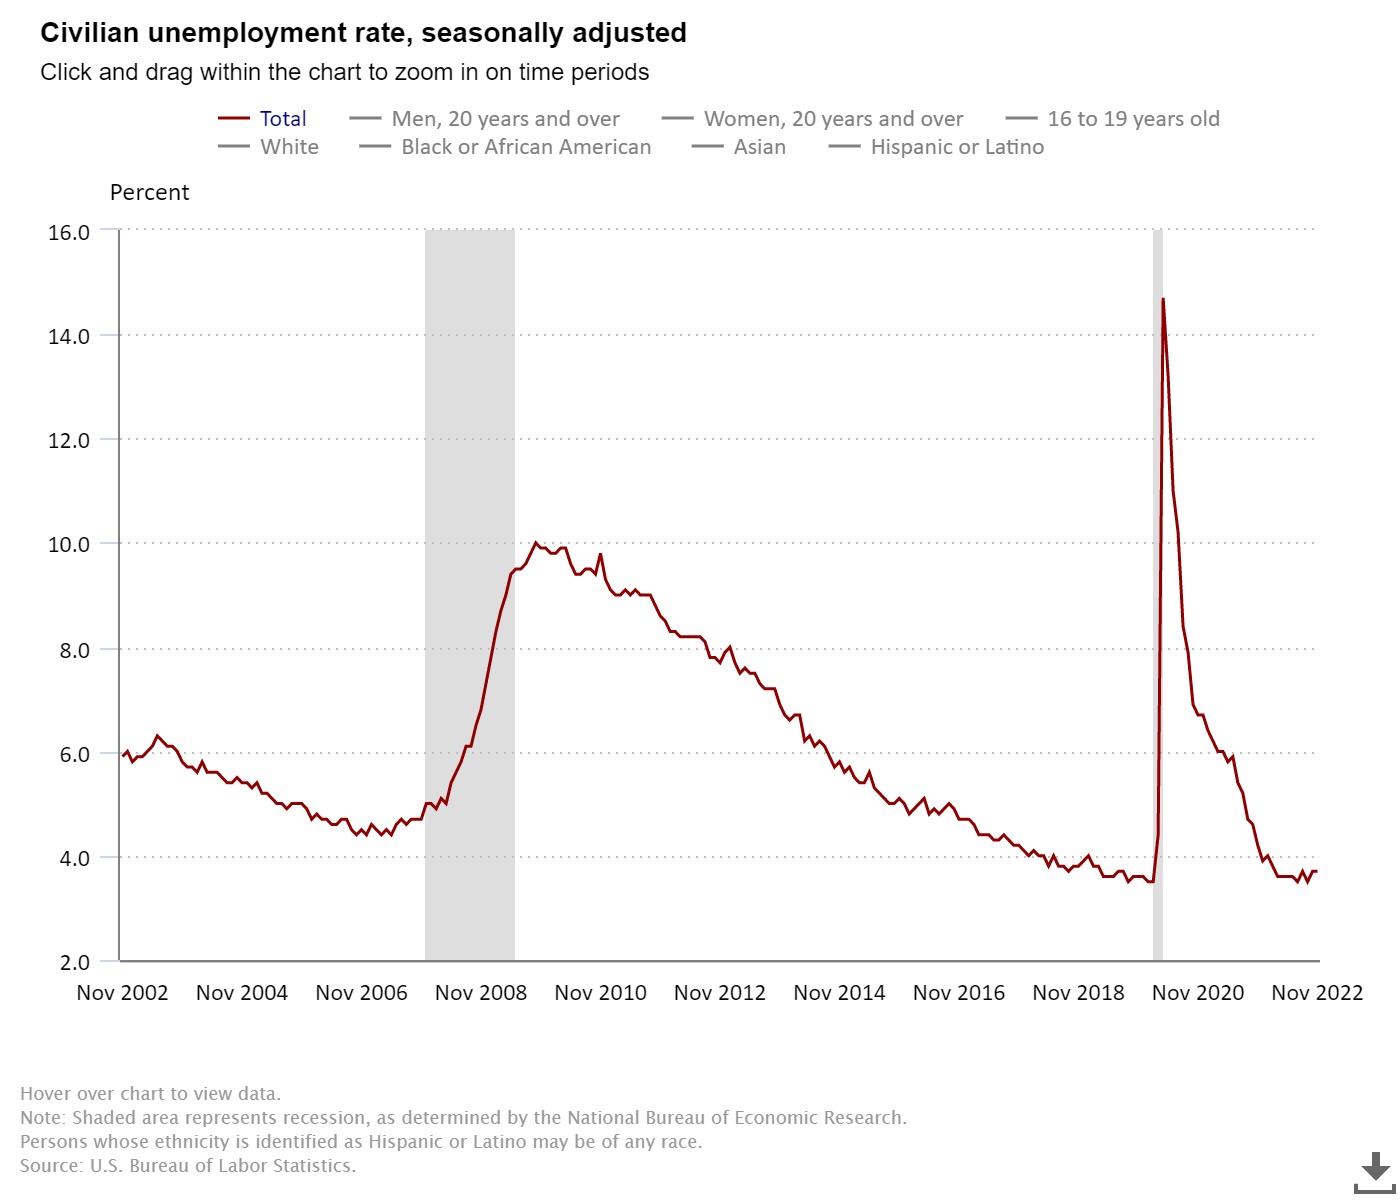
The unemployment rate was unchanged at 3.7 percent in November and has been in a narrow range of 3.5 percent to 3.7 percent since March. The number of unemployed persons was essentially unchanged at 6.0 million in November. (See table A-1.)
Among the major worker groups, the unemployment rates for adult men (3.4 percent), adult
women (3.3 percent), teenagers (11.3 percent), Whites (3.2 percent), Blacks (5.7 percent),
Asians (2.7 percent), and Hispanics (3.9 percent) showed little or no change over the
month. (See tables A-1, A-2, and A-3.)
Among the unemployed, the number of permanent job losers rose by 127,000 to 1.4 million in
November. The number of persons on temporary layoff changed little at 803,000.
(See table A-11.)
The number of long-term unemployed (those jobless for 27 weeks or more) was little changed
at 1.2 million in November. The long-term unemployed accounted for 20.6 percent of all
unemployed persons. (See table A-12.)
Both the labor force participation rate, at 62.1 percent, and the employment-population
ratio, at 59.9 percent, were little changed in November and have shown little net change
since early this year. These measures are each 1.3 percentage points below their values in
February 2020, prior to the coronavirus (COVID-19) pandemic. (See table A-1.)
The number of persons employed part time for economic reasons was about unchanged at 3.7
million in November. These individuals, who would have preferred full-time employment,
were working part time because their hours had been reduced or they were unable to find
full-time jobs. (See table A-8.)
The number of persons not in the labor force who currently want a job was little changed
at 5.6 million in November and remains above its February 2020 level of 5.0 million. These
individuals were not counted as unemployed because they were not actively looking for work
during the 4 weeks preceding the survey or were unavailable to take a job. (See table A-1.)
Among those not in the labor force who wanted a job, the number of persons marginally
attached to the labor force held at 1.5 million in November. These individuals wanted and
were available for work and had looked for a job sometime in the prior 12 months but had
not looked for work in the 4 weeks preceding the survey. The number of discouraged
workers, a subset of the marginally attached who believed that no jobs were available
for them, was 405,000 in November, little changed from the previous month. (See Summary
table A.)
Establishment Survey Data
Total nonfarm payroll employment increased by 263,000 in November, roughly in line with
average growth over the prior 3 months (+282,000). Monthly job growth has averaged 392,000
thus far in 2022, compared with 562,000 per month in 2021. In November, notable job gains
occurred in leisure and hospitality, health care, and government. Employment declined in
retail trade and in transportation and warehousing. (See table B-1.)
Leisure and hospitality added 88,000 jobs in November, including a gain of 62,000 in food
services and drinking places. Leisure and hospitality has added an average of 82,000 jobs
per month thus far this year, less than half the average gain of 196,000 jobs per month
in 2021. Employment in leisure and hospitality is below its pre-pandemic February 2020
level by 980,000, or 5.8 percent.
In November, employment in health care rose by 45,000, with gains in ambulatory health
care services (+23,000), hospitals (+11,000), and nursing and residential care facilities
(+10,000). So far in 2022, health care employment has increased by an average of 47,000
per month, well above the 2021 average monthly gain of 9,000.
Government added 42,000 jobs in November, mostly in local government (+32,000). Government
employment has increased by an average of 25,000 per month thus far this year, compared
with 38,000 per month in 2021. Since February 2020, government employment is down by
461,000, or 2.0 percent.
In November, employment in the other services industry rose by 24,000, as personal and
laundry services added 11,000 jobs over the month. Other services employment has increased
by an average of 15,000 per month thus far this year, compared with 24,000 per month in
2021. Employment in other services is below its February 2020 level by 186,000, or 3.1
percent.
Employment in social assistance increased by 23,000 in November and has returned to its
February 2020 level. Within social assistance, employment in individual and family services
increased by 17,000 in November. Job growth in social assistance has averaged 18,000 per
month thus far in 2022, compared with an average of 13,000 per month in 2021.
Construction employment continued to trend up in November (+20,000), with nonresidential
building adding 8,000 jobs. Construction has added an average of 19,000 jobs per month thus
far this year, little different from the 2021 average of 16,000 per month.
Employment in information rose by 19,000 in November. Employment in the industry has
increased by an average of 14,000 per month thus far this year, in line with the average
of 16,000 per month in 2021.
Manufacturing employment continued to trend up in November (+14,000). Job growth has
averaged 34,000 per month thus far this year, little different from the 2021 average of
30,000 per month.
In November, employment in financial activities continued its upward trend (+14,000). Job
gains in real estate and rental and leasing (+13,000) and in securities, commodity
contracts, and investments (+6,000) were partially offset by a decline in credit
intermediation and related activities (-9,000). Employment in financial activities has
increased by an average of 12,000 per month thus far this year, the same as in 2021.
Employment in retail trade declined by 30,000 in November. Job losses in general
merchandise stores (-32,000), electronics and appliance stores (-4,000), and furniture
and home furnishings stores (-3,000) were partially offset by a job gain in motor vehicle
and parts dealers (+10,000). Retail trade employment has fallen by 62,000 since August.
Employment in transportation and warehousing declined by 15,000 in November and has
decreased by 38,000 since July. In November, job losses in warehousing and storage
(-13,000) and in couriers and messengers (-12,000) were partially offset by a job gain in
air transportation (+4,000).
Employment in professional and business services changed little in November (+6,000).
Within the industry, professional and technical services added 28,000 jobs, while
business support services lost 11,000 jobs. Monthly job growth in professional and
business services has averaged 58,000 thus far in 2022, down from 94,000 per month in
2021.
Employment showed little change over the month in mining and wholesale trade.
In November, average hourly earnings for all employees on private nonfarm payrolls rose
by 18 cents, or 0.6 percent, to $32.82. Over the past 12 months, average hourly earnings
have increased by 5.1 percent. In November, average hourly earnings of private-sector
production and nonsupervisory employees rose by 19 cents, or 0.7 percent, to $28.10.
(See tables B-3 and B-8.)
In November, the average workweek for all employees on private nonfarm payrolls declined
by 0.1 hour to 34.4 hours. In manufacturing, the average workweek for all employees
decreased by 0.2 hour to 40.2 hours, and overtime declined by 0.1 hour to 3.1 hours. The
average workweek for production and nonsupervisory employees on private nonfarm payrolls
decreased by 0.1 hour to 33.9 hours. (See tables B-2 and B-7.)
The change in total nonfarm payroll employment for September was revised down by 46,000,
from +315,000 to +269,000, and the change for October was revised up by 23,000, from
+261,000 to +284,000. With these revisions, employment gains in September and October
combined were 23,000 lower than previously reported. (Monthly revisions result from
additional reports received from businesses and government agencies since the last
published estimates and from the recalculation of seasonal factors.)
_____________
The Employment Situation for December is scheduled to be released on Friday, January 6,
2023, at 8:30 a.m. (ET).
_______________________________________________________________________________________
| |
| Revision of Seasonally Adjusted Household Survey Data |
| |
| In accordance with usual practice, The Employment Situation news release for December |
| 2022, scheduled for January 6, 2023, will incorporate annual revisions in seasonally |
| adjusted household survey data. Seasonally adjusted data for the most recent 5 years |
| are subject to revision. |
|_______________________________________________________________________________________|
_______________________________________________________________________________________
| |
| Update to the 2022 North American Industry Classification System |
| |
| With the release of January 2023 data on February 3, 2023, the establishment survey |
| will revise the basis for industry classification from the 2017 North American |
| Industry Classification System (NAICS) to NAICS 2022. The conversion to NAICS 2022 |
| will result in minor revisions reflecting content and coding changes within the |
| mining and logging, manufacturing, wholesale trade, financial activities, and other |
| services sectors, as well as major revisions reflecting content and coding changes in |
| the retail trade and information sectors. Many industry titles and descriptions will |
| also be updated to better reflect official NAICS titles. Approximately 10 percent of |
| employment will be reclassified into different industries as a result of the |
| revision. Details of updated titles and new, discontinued, and collapsed industries |
| resulting from the NAICS 2022 update, as well as changes due to the annual |
| benchmarking process, will be available on January 6, 2023. |
| |
| For more information on NAICS 2022, visit www.census.gov/naics. |
|_______________________________________________________________________________________|
263,000 Jobs Added and Unemployment Rate Holds at 3.7% in Latest Jobs Report added by admin on
View all posts by admin →