

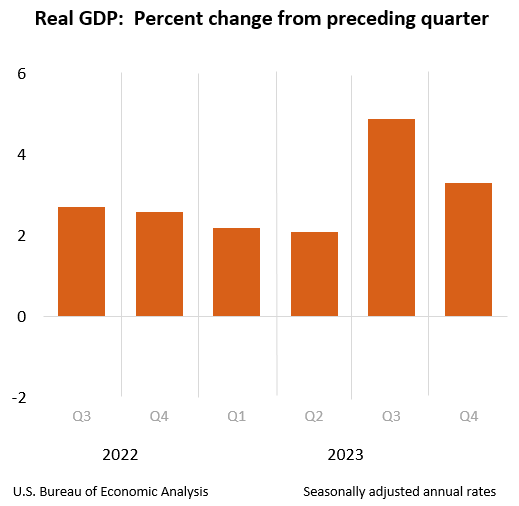
Washington, DC…Real gross domestic product (GDP) increased at an annual rate of 3.3 percent in the fourth quarter of 2023 (table 1), according to the “advance” estimate released by the Bureau of Economic Analysis. In the third quarter, real GDP increased 4.9 percent.
The GDP estimate released today is based on source data that are incomplete or subject to further revision by the source agency (refer to “Source Data for the Advance Estimate” on page 3). The “second” estimate for the fourth quarter, based on more complete data, will be released on February 28, 2024.
Real GDP: Percent change from preceding quarter
The increase in real GDP reflected increases in consumer spending, exports, state and local government spending, nonresidential fixed investment, federal government spending, private inventory investment, and residential fixed investment (table 2). Imports, which are a subtraction in the calculation of GDP, increased.
The increase in consumer spending reflected increases in both services and goods. Within services, the leading contributors were food services and accommodations as well as health care. Within goods, the leading contributors to the increase were other nondurable goods (led by pharmaceutical products) and recreational goods and vehicles (led by computer software). Within exports, both goods (led by petroleum) and services (led by financial services) increased. The increase in state and local government spending primarily reflected increases in compensation of state and local government employees and investment in structures. The increase in nonresidential fixed investment reflected increases in intellectual property products, structures, and equipment. Within federal government spending, the increase was led by nondefense spending. The increase in inventory investment was led by wholesale trade industries. Within residential fixed investment, the increase reflected an increase in new residential structures that was partly offset by a decrease in brokers’ commissions. Within imports, the increase primarily reflected an increase in services (led by travel).
Compared to the third quarter of 2023, the deceleration in real GDP in the fourth quarter primarily reflected slowdowns in private inventory investment, federal government spending, residential fixed investment, and consumer spending. Imports decelerated.
Current‑dollar GDP increased 4.8 percent at an annual rate, or $328.7 billion, in the fourth quarter to a level of $27.94 trillion. In the third quarter, GDP increased 8.3 percent, or $547.1 billion (tables 1 and 3).
The price index for gross domestic purchases increased 1.9 percent in the fourth quarter, compared with an increase of 2.9 percent in the third quarter (table 4). The personal consumption expenditures (PCE) price index increased 1.7 percent, compared with an increase of 2.6 percent. Excluding food and energy prices, the PCE price index increased 2.0 percent, the same change as the third quarter.
Personal Income
Current-dollar personal income increased $224.8 billion in the fourth quarter, compared with an increase of $196.2 billion in the third quarter. The increase primarily reflected increases in compensation, personal income receipts on assets, and proprietors’ income that were partly offset by a decrease in personal current transfer receipts (table 8).
Disposable personal income increased $211.7 billion, or 4.2 percent, in the fourth quarter, compared with an increase of $143.5 billion, or 2.9 percent, in the third quarter. Real disposable personal income increased 2.5 percent, compared with an increase of 0.3 percent.
Personal saving was $818.9 billion in the fourth quarter, compared with $851.2 billion in the third quarter. The personal saving rate—personal saving as a percentage of disposable personal income—was 4.0 percent in the fourth quarter, compared with 4.2 percent in the third quarter.
GDP for 2023
Real GDP increased 2.5 percent in 2023 (from the 2022 annual level to the 2023 annual level), compared with an increase of 1.9 percent in 2022 (table 1). The increase in real GDP in 2023 primarily reflected increases in consumer spending, nonresidential fixed investment, state and local government spending, exports, and federal government spending that were partly offset by decreases in residential fixed investment and inventory investment. Imports decreased (table 2).
The increase in consumer spending reflected increases in services (led by health care) and goods (led by recreational goods and vehicles). The increase in nonresidential fixed investment reflected increases in structures and intellectual property products. The increase in state and local government spending reflected increases in gross investment in structures and in compensation of state and local government employees. The increase in exports reflected increases in both goods and services. The increase in federal government spending reflected increases in both nondefense and defense spending.
The decrease in residential fixed investment mainly reflected a decrease in new single-family construction as well as brokers’ commissions. The decrease in private inventory investment primarily reflected a decrease in wholesale trade industries. Within imports, the decrease primarily reflected a decrease in goods.
Current-dollar GDP increased 6.3 percent, or $1.61 trillion, in 2023 to a level of $27.36 trillion, compared with an increase of 9.1 percent, or $2.15 trillion, in 2022 (tables 1 and 3).
The price index for gross domestic purchases increased 3.4 percent in 2023, compared with an increase of 6.8 percent in 2022 (table 4). The PCE price index increased 3.7 percent, compared with an increase of 6.5 percent. Excluding food and energy prices, the PCE price index increased 4.1 percent, compared with an increase of 5.2 percent.
Measured from the fourth quarter of 2022 to the fourth quarter of 2023, real GDP increased 3.1 percent during the period (table 6), compared with an increase of 0.7 percent from the fourth quarter of 2021 to the fourth quarter of 2022.
The price index for gross domestic purchases, as measured from the fourth quarter of 2022 to the fourth quarter of 2023, increased 2.4 percent, compared with an increase of 6.2 percent from the fourth quarter of 2021 to the fourth quarter of 2022. The PCE price index increased 2.7 percent, compared with an increase of 5.9 percent. Excluding food and energy, the PCE price index increased 3.2 percent, compared with 5.1 percent.
Source Data for the Advance Estimate
The GDP estimate released today is based on source data that are incomplete or subject to further revision by the source agency. Information on the source data and key assumptions used in the advance estimate is provided in a Technical Note and a detailed “Key Source Data and Assumptions” file posted with the release. The “second” estimate for the fourth quarter, based on more complete data, will be released on February 28, 2024. For information on updates to GDP, refer to the “Additional Information” section that follows.
* * *
Next release, February 28, 2024, at 8:30 a.m. EST
Gross Domestic Product (Second Estimate)
Fourth Quarter 2023 and Year 2023
* * *
Gross Domestic Product Roared in Fourth Quarter at 3.3% Rate! Third Quarter at 4.9% added by admin on
View all posts by admin →