

Washington, DC…Total nonfarm payroll employment rose by 157,000 in July, and the unemployment rate edged down to 3.9 percent, the U.S. Bureau of Labor Statistics reported today. Employment increased in professional and business services, in manufacturing, and in health care and social assistance. Household Survey Data In July, the unemployment rate edged down by 0.1 percentage point to 3.9 percent, following an increase in June. The number of unemployed persons declined by 284,000 to 6.3 million in July. Both measures were down over the year, by 0.4 percentage point and 676,000, respectively.
(See table A-1.)
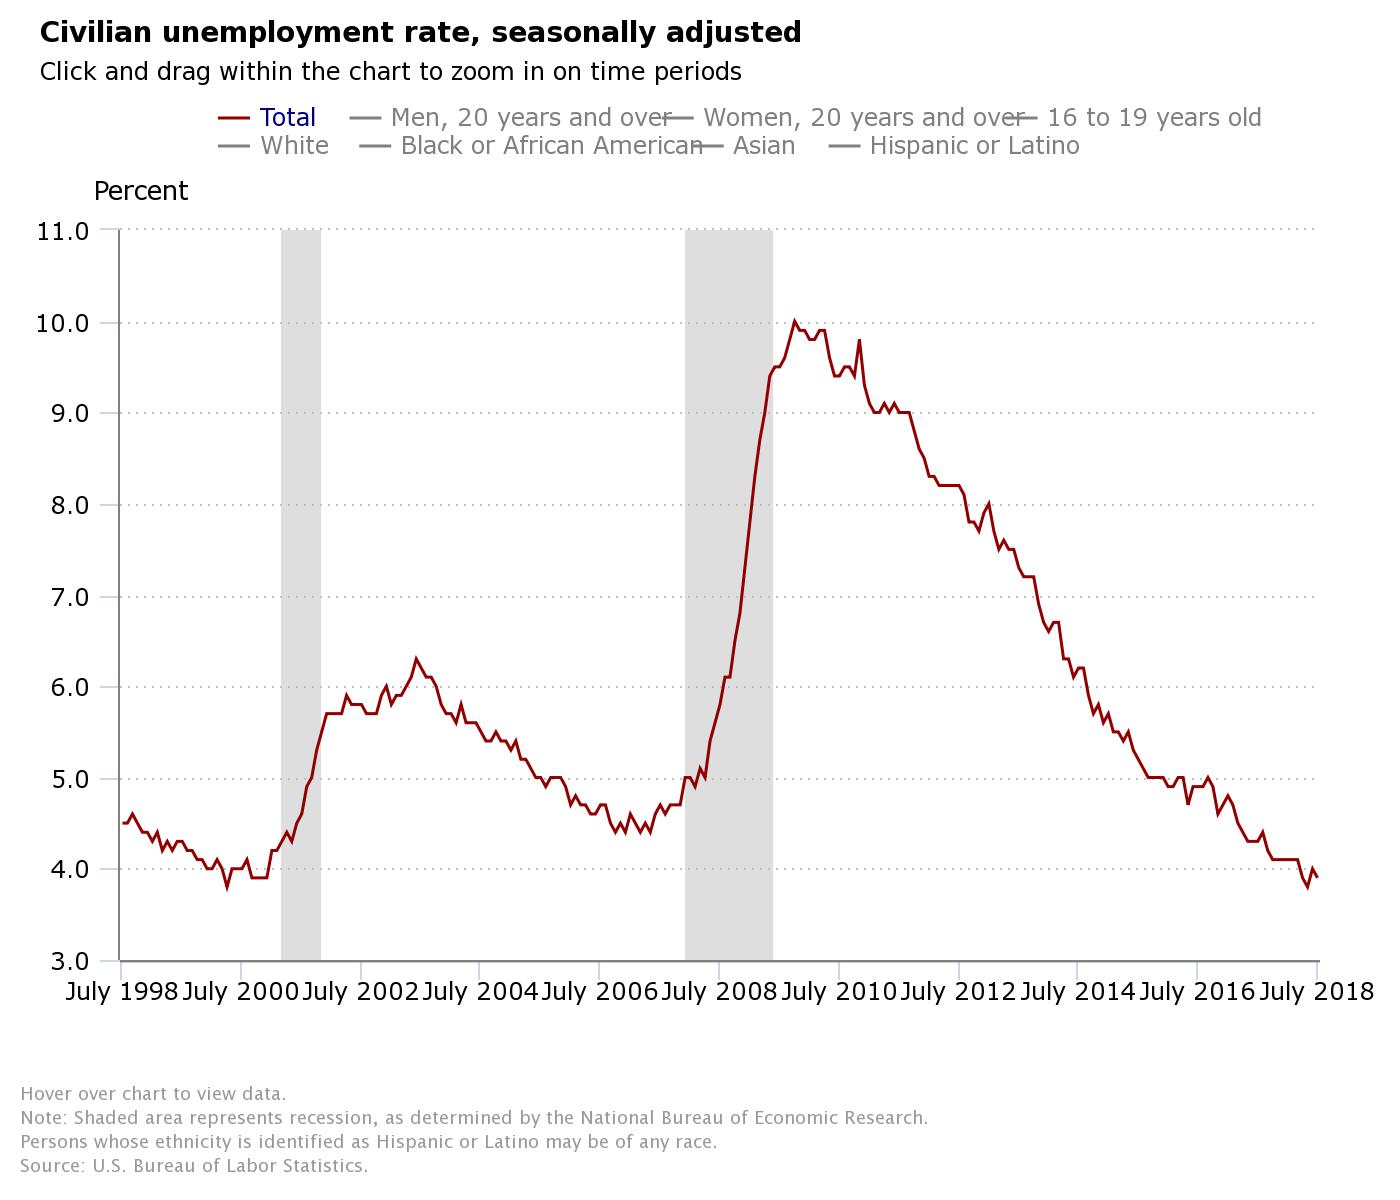
Among the major worker groups, the unemployment rates for adult men (3.4 percent) and Whites (3.4 percent) declined in July. The jobless rates for adult women (3.7 percent), teenagers (13.1 percent), Blacks (6.6 percent), Asians (3.1 percent), and Hispanics (4.5 percent) showed little or no change over the month. (See tables A-1, A-2, and A-3.)
Among the unemployed, the number of reentrants to the labor force decreased by 287,000 in July to 1.8 million, following an increase in June. (Reentrants are persons who previously worked but were not in the labor force prior to beginning their job search.) (See table A-11.)
The number of long-term unemployed (those jobless for 27 weeks or more) was essentially
unchanged at 1.4 million in July and accounted for 22.7 percent of the unemployed. (See table
A-12.)
The labor force participation rate, at 62.9 percent in July, was unchanged over the month and
over the year. The employment-population ratio, at 60.5 percent, was little changed in July but
has increased by 0.3 percentage point over the year. (See table A-1.)
The number of persons employed part time for economic reasons (sometimes referred to as
involuntary part-time workers) was little changed in July, at 4.6 million, but was down by
669,000 over the year. These individuals, who would have preferred full-time employment, were
working part time because their hours had been reduced or they were unable to find full-time
jobs. (See table A-8.)
In July, 1.5 million persons were marginally attached to the labor force, little different from
a year earlier. (Data are not seasonally adjusted.) These individuals were not in the labor
force, wanted and were available for work, and had looked for a job sometime in the prior 12
months. They were not counted as unemployed because they had not searched for work in the 4
weeks preceding the survey. (See table A-16.)
Among the marginally attached, there were 512,000 discouraged workers in July, little changed
from a year earlier. Discouraged workers are persons not currently looking for work because
they believe no jobs are available for them. The remaining 1.0 million persons marginally
attached to the labor force in July had not searched for work for reasons such as school
attendance or family responsibilities. (See table A-16.)
Establishment Survey Data
Total nonfarm payroll employment increased by 157,000 in July, compared with an average monthly
gain of 203,000 over the prior 12 months. In July, job gains occurred in professional and
business services, in manufacturing, and in health care and social assistance. (See table B-1.)
Employment in professional and business services increased by 51,000 in July and has risen by
518,000 over the year. Over the month, employment edged up in temporary help services (+28,000)
and in computer systems design and related services (+8,000).
Manufacturing added 37,000 jobs in July, with most of the gain in the durable goods component.
Employment rose in transportation equipment (+13,000), machinery (+6,000), and electronic
instruments (+2,000). Over the past 12 months, manufacturing has added 327,000 jobs.
In July, employment in health care and social assistance rose by 34,000. Health care employment
continued to trend up over the month (+17,000) and has increased by 286,000 over the year.
Hospitals added 7,000 jobs over the month. Within social assistance, individual and family
services added 16,000 jobs in July and 77,000 jobs over the year.
Employment in food services and drinking places continued to trend up over the month (+26,000).
Over the year, the industry has added 203,000 jobs.
Construction employment continued to trend up in July (+19,000) and has increased by 308,000
over the year.
In July, employment in retail trade changed little (+7,000). Job gains occurred in general
merchandise stores (+14,000), clothing and clothing accessories stores (+10,000), and food and
beverage stores (+8,000). These employment gains were offset by a decline of 32,000 in sporting
goods, hobby, book, and music stores, reflecting job losses in hobby, toy, and game stores.
Employment showed little or no change over the month in other major industries, including
mining, wholesale trade, transportation and warehousing, information, financial activities,
and government.
The average workweek for all employees on private nonfarm payrolls decreased by 0.1 hour to
34.5 hours in July, following an increase of 0.1 hour in June. In manufacturing, both the
workweek and overtime were unchanged in July, at 40.9 hours and 3.5 hours, respectively. The
average workweek for production and nonsupervisory employees on private nonfarm payrolls
remained at 33.8 hours. (See tables B-2 and B-7.)
In July, average hourly earnings for all employees on private nonfarm payrolls rose by 7 cents
to $27.05. Over the year, average hourly earnings have increased by 71 cents, or 2.7 percent.
Average hourly earnings of private-sector production and nonsupervisory employees increased by
3 cents to $22.65 in July. (See tables B-3 and B-8.)
The change in total nonfarm payroll employment for May was revised up from +244,000 to
+268,000, and the change for June was revised up from +213,000 to +248,000. With these
revisions, employment gains in May and June combined were 59,000 more than previously
reported. (Monthly revisions result from additional reports received from businesses and
government agencies since the last published estimates and from the recalculation of
seasonal factors.) After revisions, job gains have averaged 224,000 per month over the
last 3 months.
_____________
The Employment Situation for August is scheduled to be released on Friday, September 7, 2018,
at 8:30 a.m. (EDT).
_______________________________________________________________________________________
| |
| 2018 Preliminary Benchmark Revision to the Establishment Survey Data will be |
| Released on August 22, 2018 |
| |
|Each year, the establishment survey estimates are benchmarked to comprehensive counts |
|of employment from the Quarterly Census of Employment and Wages (QCEW) for the month |
|of March. These counts are derived from state unemployment insurance (UI) tax records |
|that nearly all employers are required to file. On August 22, 2018, at 10:00 a.m. |
|(EDT), the Bureau of Labor Statistics (BLS) will release the preliminary estimate of |
|the upcoming annual benchmark revision. This is the same day the first-quarter 2018 |
|data from QCEW will be issued. Preliminary benchmark revisions for all major industry |
|sectors, as well as total nonfarm and total private levels, will be available on the |
|BLS website at www.bls.gov/web/empsit/cesprelbmk.htm. The final benchmark revision |
|will be issued with the publication of the January 2019 Employment Situation news |
|release in February 2019. |
|_______________________________________________________________________________________|
Employment Situation Summary Table A. Household data, seasonally adjusted
Employment Situation Summary Table B. Establishment data, seasonally adjusted
Employment Situation Frequently Asked Questions
Employment Situation Technical Note
Table A-1. Employment status of the civilian population by sex and age
Table A-2. Employment status of the civilian population by race, sex, and age
Table A-3. Employment status of the Hispanic or Latino population by sex and age
Table A-4. Employment status of the civilian population 25 years and over by educational attainment
Table A-5. Employment status of the civilian population 18 years and over by veteran status, period of service, and sex, not seasonally adjusted
Table A-6. Employment status of the civilian population by sex, age, and disability status, not seasonally adjusted
Table A-7. Employment status of the civilian population by nativity and sex, not seasonally adjusted
Table A-8. Employed persons by class of worker and part-time status
Table A-9. Selected employment indicators
Table A-10. Selected unemployment indicators, seasonally adjusted
Table A-11. Unemployed persons by reason for unemployment
Table A-12. Unemployed persons by duration of unemployment
Table A-13. Employed and unemployed persons by occupation, not seasonally adjusted
Table A-14. Unemployed persons by industry and class of worker, not seasonally adjusted
Table A-15. Alternative measures of labor underutilization
Table A-16. Persons not in the labor force and multiple jobholders by sex, not seasonally adjusted
Table B-1. Employees on nonfarm payrolls by industry sector and selected industry detail
Table B-2. Average weekly hours and overtime of all employees on private nonfarm payrolls by industry sector, seasonally adjusted
Table B-3. Average hourly and weekly earnings of all employees on private nonfarm payrolls by industry sector, seasonally adjusted
Table B-4. Indexes of aggregate weekly hours and payrolls for all employees on private nonfarm payrolls by industry sector, seasonally adjusted
Table B-5. Employment of women on nonfarm payrolls by industry sector, seasonally adjusted
Table B-6. Employment of production and nonsupervisory employees on private nonfarm payrolls by industry sector, seasonally adjusted(1)
Table B-7. Average weekly hours and overtime of production and nonsupervisory employees on private nonfarm payrolls by industry sector, seasonally adjusted(1)
Table B-8. Average hourly and weekly earnings of production and nonsupervisory employees on private nonfarm payrolls by industry sector, seasonally adjusted(1)
Table B-9. Indexes of aggregate weekly hours and payrolls for production and nonsupervisory employees on private nonfarm payrolls by industry sector, seasonally adjusted(1)
Access to historical data for the “A” tables of the Employment Situation News Release
Access to historical data for the “B” tables of the Employment Situation News Release
The Economy 157,000 Jobs in July as Economy Shows Continued Strength added by admin on
View all posts by admin →