


Washington, DC…The COVID-19 virus continues to impact the number of initial claims and its impact is also reflected in the increasing levels of insured unemployment. In the week ending April 4, the advance figure for seasonally adjusted initial claims was 6,606,000, a decrease of 261,000 from the previous week’s revised level. The previous week’s level was revised up by 219,000 from 6,648,000 to 6,867,000. The 4-week moving average was 4,265,500, an increase of 1,598,750 from the previous week’s revised average. The previous week’s average was revised up by 54,750 from 2,612,000 to 2,666,750.
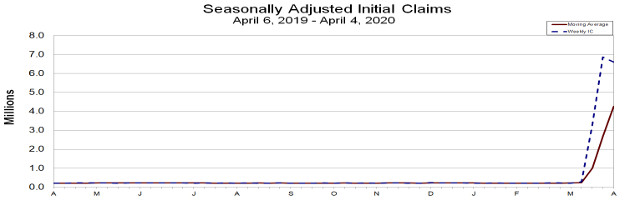
The advance seasonally adjusted insured unemployment rate was 5.1 percent for the week ending March 28, an increase of 3.0 percentage points from the previous week’s unrevised rate. The advance number for seasonally adjusted insured unemployment during the week ending March 28 was 7,455,000, an increase of 4,396,000 from the previous week’s revised level. This marks the highest level of seasonally adjusted insured unemployment in the history of the seasonally adjusted series. The previous high was 6,635,000 in May of 2009. The previous week’s level was revised up 30,000 from 3,029,000 to 3,059,000. The 4-week moving average was 3,500,000, an increase of 1,439,000 from the previous week’s revised average. The previous week’s average was revised up by 7,500 from 2,053,500 to 2,061,000.
UNADJUSTED DATA
The advance number of actual initial claims under state programs, unadjusted, totaled 6,203,359 in the week ending April 4, an increase of 187,538 (or 3.1 percent) from the previous week. The seasonal factors had expected an increase of 432,645 (or 7.2 percent) from the previous week. There were 196,071 initial claims in the comparable week in 2019.
The advance unadjusted insured unemployment rate was 5.6 percent during the week ending March 28, an increase of 3.2 percentage points from the prior week. The advance unadjusted number for persons claiming UI benefits in state programs totaled 8,177,965, an increase of 4,761,372 (or 139.4 percent) from the preceding week. The seasonal factors had expected a decrease of 61,174 (or -1.8 percent) from the previous week. A year earlier the rate was 1.3 percent and the volume was 1,861,690.
The total number of people claiming benefits in all programs for the week ending March 21 was 3,447,727, an increase of 1,342,462 from the previous week. There were 1,937,342 persons claiming benefits in all programs in the comparable week in 2019.
No state was triggered “on” the Extended Benefits program during the week ending March 21.
Initial claims for UI benefits filed by former Federal civilian employees totaled 2,451 in the week ending March 28, an increase of 1,169 from the prior week. There were 1,752 initial claims filed by newly discharged veterans, an increase of 855 from the preceding week.
There were 9,378 former Federal civilian employees claiming UI benefits for the week ending March 21, a decrease of 414 from the previous week. Newly discharged veterans claiming benefits totaled 5,479, a decrease of 112 from the prior week.
The highest insured unemployment rates in the week ending March 21 were in Rhode Island (6.7), Minnesota (5.6), Massachusetts (5.1), Connecticut (4.9), Washington (4.7), Vermont (4.5), Nevada (4.3), Montana (4.2), New Hampshire (4.2), and Ohio (4.0).
The largest increases in initial claims for the week ending March 28 were in California (+871,992), New York (+286,596), Michigan (+176,329), Florida (+154,171), Georgia (+121,680), Texas (+120,759), and New Jersey (+90,438), while the largest decreases were in Nevada (-20,356), Rhode Island (-8,047), and Minnesota (-6,678).
UNEMPLOYMENT INSURANCE DATA FOR REGULAR STATE PROGRAMS WEEK ENDING April 4 March 28 Change March 21 Prior Year1 Initial Claims (SA) 6,606,000 6,867,000 -261,000 3,307,000 203,000 Initial Claims (NSA) 6,203,359 6,015,821 +187,538 2,920,162 196,071 4-Wk Moving Average (SA) 4,265,500 2,666,750 +1,598,750 1,004,250 212,000 WEEK ENDING March 28 March 21 Change March 14 Prior Year1 Insured Unemployment (SA) 7,455,000 3,059,000 +4,396,000 1,784,000 1,705,000 Insured Unemployment (NSA) 8,177,965 3,416,593 +4,761,372 2,074,782 1,861,690 4-Wk Moving Average (SA) 3,500,000 2,061,000 +1,439,000 1,726,250 1,722,500 Insured Unemployment Rate (SA)2 5.1% 2.1% +3.0 1.2% 1.2% Insured Unemployment Rate (NSA)2 5.6% 2.4% +3.2 1.4% 1.3% INITIAL CLAIMS FILED IN FEDERAL PROGRAMS (UNADJUSTED) WEEK ENDING March 28 March 21 Change Prior Year1 Federal Employees (UCFE) 2,451 1,282 +1,169 571 Newly Discharged Veterans (UCX) 1,752 897 +855 447 PERSONS CLAIMING UI BENEFITS IN ALL PROGRAMS (UNADJUSTED) WEEK ENDING March 21 March 14 Change Prior Year1 Regular State 3,410,969 2,071,116 +1,339,853 1,905,781 Federal Employees 9,378 9,792 -414 10,076 Newly Discharged Veterans 5,479 5,591 -112 6,103 Extended Benefits3 0 0 0 1 State Additional Benefits4 5,449 5,901 -452 6,019 STC / Workshare 5 16,452 12,865 +3,587 9,362 TOTAL 3,447,727 2,105,265 +1,342,462 1,937,342
FOOTNOTES SA – Seasonally Adjusted Data, NSA – Not Seasonally Adjusted Data
1. Prior year is comparable to most recent data.
2. Most recent week used covered employment of 145,230,691 as denominator.
3. Information on the EB program can be found here: EB Program information
4. Some states maintain additional benefit programs for those claimants who exhaust regular benefits, and when applicable, extended benefits. Information on states that participate, and the extent of benefits paid, can be found starting on page 4-4 of this link: Extensions and Special Programs PDF
5. Information on STC/Worksharing can be found starting on page 4-8 of the following link: Extensions and Special Programs PDF
Advance State Claims – Not Seasonally Adjusted Initial Claims Filed During Week Ended April 4 Insured Unemployment For Week Ended March 28 STATE Advance Prior Wk Change Advance Prior Wk Change Alabama 105,607 80,984 24,623 40,882 18,083 22,799 Alaska 15,370 13,774 1,596 19,644 11,173 8,471 Arizona 132,189 88,940 43,249 59,977 26,387 33,590 Arkansas 60,992 27,756 33,236 34,906 16,148 18,758 California 925,450 1,058,325 -132,875 1,084,955 400,565 684,390 Colorado 45,494 61,838 -16,344 73,586 21,956 51,630 Connecticut 33,418 33,227 191 149,490 80,861 68,629 Delaware 18,863 19,137 -274 23,881 11,506 12,375 District of Columbia 15,393 15,869 -476 29,526 17,661 11,865 Florida 169,885 228,484 -58,599 98,924 35,076 63,848 Georgia 388,175 133,820 254,355 359,105 107,877 251,228 Hawaii 53,082 48,596 4,486 32,459 10,930 21,529 Idaho 30,022 32,941 -2,919 35,211 15,523 19,688 Illinois 200,940 178,421 22,519 263,732 132,114 131,618 Indiana 133,639 139,174 -5,535 75,522 28,987 46,535 Iowa 67,334 55,966 11,368 92,962 53,650 39,312 Kansas 49,756 54,330 -4,574 51,786 17,558 34,228 Kentucky 117,135 113,149 3,986 130,152 24,361 105,791 Louisiana 102,985 97,400 5,585 116,752 58,027 58,725 Maine 30,631 23,770 6,861 40,592 21,967 18,625 Maryland 107,408 85,317 22,091 90,153 47,973 42,180 Massachusetts 139,582 181,423 -41,841 306,580 183,105 123,475 Michigan 384,844 304,335 80,509 363,885 88,183 275,702 Minnesota 111,119 109,095 2,024 256,689 160,873 95,816 Mississippi 46,504 32,015 14,489 27,948 9,581 18,367 Missouri 82,399 104,291 -21,892 118,924 49,470 69,454 Montana 20,011 20,763 -752 37,393 19,099 18,294 Nebraska 26,788 24,725 2,063 37,805 16,641 21,164 Nevada 79,865 71,942 7,923 129,127 58,798 70,329 New Hampshire 36,214 31,378 4836 51,509 27,321 24,188 New Jersey 213,897 206,253 7,644 277,761 156,181 121,580 New Mexico 26,606 27,849 -1,243 46,620 20,087 26,533 New York 345,246 366,595 -21,349 715,750 314,710 401,040 North Carolina 137,573 172,145 -34,572 246,082 75,220 170,862 North Dakota 16,093 11,818 4,275 17,507 8,534 8,973 Ohio 224,182 274,288 -50,106 447,494 214,273 233,221 Oklahoma 51,124 47,744 3,380 54,469 25,268 29,201 Oregon 56,646 47,498 9,148 118,995 63,930 55,065 Pennsylvania * 283,718 404,677 -120,959 571,732 135,708 436,024 Puerto Rico 66,349 45,394 20,955 41,491 19,230 22,261 Rhode Island 28,255 27,800 455 56,668 31,847 24,821 South Carolina 85,018 66,475 18,543 73,653 30,341 43,312 South Dakota 7,916 6,801 1115 7,492 3,538 3,954 Tennessee 116,141 92,500 23,641 116,345 37,541 78,804 Texas 313,832 276,185 37,647 376,955 144,697 232,258 Utah 33,076 28,532 4,544 43,962 24,635 19,327 Vermont 16,176 14,633 1,543 22,175 13,797 8,378 Virgin Islands 11 250 -239 660 512 148 Virginia 149,758 112,497 37,261 133,601 41,827 91,774 Washington 176,827 182,849 -6,022 315,085 158,025 157,060 West Virginia 14,145 14,523 -378 41,404 21,145 20,259 Wisconsin 104,776 110,934 -6,158 209,288 99,574 109,714 Wyoming 4,900 6,396 -1,496 8,719 4,519 4,200 US Total 6,203,359 6,015,821 187,538 8,177,965 3,416,593 4,761,372
Note: Advance claims are not directly comparable to claims reported in prior weeks. Advance claims are reported by the state liable for paying the unemployment compensation, whereas previous weeks reported claims reflect claimants by state of residence. In addition, claims reported as “workshare equivalent” in the previous week are added to the advance claims as a proxy for the current week’s “workshare equivalent” activity.
*Denotes state estimate.
6
Seasonally Adjusted US Weekly UI Claims (in thousands) Week Ending Initial Claims Change from Prior Week 4-Week Average Insured Unemployment Change from Prior Week 4-Week Average IUR March 30, 2019 211 -4 217.25 1,705 -14 1,722.50 1.2 April 6, 2019 203 -8 212.00 1,667 -38 1,705.75 1.2 April 13, 2019 203 0 208.00 1,659 -8 1,687.50 1.2 April 20, 2019 226 23 210.75 1,682 23 1,678.25 1.2 April 27, 2019 230 4 215.50 1,684 2 1,673.00 1.2 May 4, 2019 225 -5 221.00 1,678 -6 1,675.75 1.2 May 11, 2019 217 -8 224.50 1,683 5 1,681.75 1.2 May 18, 2019 213 -4 221.25 1,675 -8 1,680.00 1.2 May 25, 2019 218 5 218.25 1,695 20 1,682.75 1.2 June 1, 2019 220 2 217.00 1,700 5 1,688.25 1.2 June 8, 2019 220 0 217.75 1,677 -23 1,686.75 1.2 June 15, 2019 219 -1 219.25 1,692 15 1,691.00 1.2 June 22, 2019 224 5 220.75 1,699 7 1,692.00 1.2 June 29, 2019 222 -2 221.25 1,717 18 1,696.25 1.2 July 6, 2019 211 -11 219.00 1,694 -23 1,700.50 1.2 July 13, 2019 217 6 218.50 1,682 -12 1,698.00 1.2 July 20, 2019 211 -6 215.25 1,699 17 1,698.00 1.2 July 27, 2019 216 5 213.75 1,692 -7 1,691.75 1.2 August 3, 2019 214 -2 214.50 1,719 27 1,698.00 1.2 August 10, 2019 218 4 214.75 1,687 -32 1,699.25 1.2 August 17, 2019 215 -3 215.75 1,699 12 1,699.25 1.2 August 24, 2019 215 0 215.50 1,683 -16 1,697.00 1.2 August 31, 2019 219 4 216.75 1,683 0 1,688.00 1.2 September 7, 2019 208 -11 214.25 1,675 -8 1,685.00 1.2 September 14, 2019 211 3 213.25 1,672 -3 1,678.25 1.2 September 21, 2019 215 4 213.25 1,667 -5 1,674.25 1.2 September 28, 2019 218 3 213.00 1,698 31 1,678.00 1.2 October 5, 2019 212 -6 214.00 1,689 -9 1,681.50 1.2 October 12, 2019 218 6 215.75 1,691 2 1,686.25 1.2 October 19, 2019 213 -5 215.25 1,700 9 1,694.50 1.2 October 26, 2019 217 4 215.00 1,695 -5 1,693.75 1.2 November 2, 2019 212 -5 215.00 1,702 7 1,697.00 1.2 November 9, 2019 222 10 216.00 1,697 -5 1,698.50 1.2 November 16, 2019 223 1 218.50 1,665 -32 1,689.75 1.2 November 23, 2019 211 -12 217.00 1,697 32 1,690.25 1.2 November 30, 2019 206 -5 215.50 1,700 3 1,689.75 1.2 December 7, 2019 237 31 219.25 1,725 25 1,696.75 1.2 December 14, 2019 229 -8 220.75 1,716 -9 1,709.50 1.2 December 21, 2019 218 -11 222.50 1,728 12 1,717.25 1.2 December 28, 2019 220 2 226.00 1,775 47 1,736.00 1.2 January 4, 2020 212 -8 219.75 1,759 -16 1,744.50 1.2 January 11, 2020 207 -5 214.25 1,735 -24 1,749.25 1.2 January 18, 2020 220 13 214.75 1,704 -31 1,743.25 1.2 January 25, 2020 212 -8 212.75 1,753 49 1,737.75 1.2 February 1, 2020 201 -11 210.00 1,678 -75 1,717.50 1.2 February 8, 2020 204 3 209.25 1,729 51 1,716.00 1.2 February 15, 2020 215 11 208.00 1,693 -36 1,713.25 1.2 February 22, 2020 220 5 210.00 1,720 27 1,705.00 1.2 February 29, 2020 217 -3 214.00 1,699 -21 1,710.25 1.2 March 7, 2020 211 -6 215.75 1,702 3 1,703.50 1.2 March 14, 2020 282 71 232.50 1,784 82 1,726.25 1.2 March 21, 2020 3,307 3,025 1,004.25 3,059 1,275 2,061.00 2.1 March 28, 2020 6,867 3,560 2,666.75 7,455 4,396 3,500.00 5.1 April 4, 2020 6,606 -261 4,265.50
INITIAL CLAIMS FILED DURING WEEK ENDED MARCH 28 INSURED UNEMPLOYMENT FOR WEEK ENDED MARCH 21 CHANGE FROM CHANGE FROM ALL STATE NAME STATE LAST WEEK YEAR AGO UCFE 1 UCX1 STATE (%) 2 LAST WEEK YEAR AGO UCFE 1 UCX1 PROGRAMS EXCLUDING RAILROAD RETIREMENT Alabama 80984 70092 78734 48 32 18083 0.9 5596 3952 50 36 18169 Alaska 13774 5927 12887 8 0 11173 3.6 2661 2650 125 13 11311 Arizona 88940 59592 85200 22 19 26387 0.9 8279 7275 171 32 26590 Arkansas 27756 18481 26537 3 3 16148 1.4 5160 5145 65 35 16248 California 1058325 871992 1019797 186 72 400565 2.3 -21347 31907 2222 977 403764 Colorado 61838 42064 60355 24 38 21956 0.8 647 1602 210 122 22288 Connecticut 33227 8127 31265 8 1 80861 4.9 36667 41671 44 57 80962 Delaware 19137 8361 18712 1 9 11506 2.6 6209 5557 9 14 11529 District of Columbia 15869 1407 15490 97 0 17661 3.1 10283 10644 195 7 17863 Florida 228484 154171 223180 95 164 35076 0.4 1348 499 145 93 35314 Georgia 133820 121680 129649 32 28 107877 2.5 80370 83933 187 131 108195 Hawaii 48596 39779 47347 2 41 10930 1.8 4458 4284 55 47 11032 Idaho 32941 19355 31750 23 3 15523 2.1 7654 7512 180 19 15722 Illinois 178421 64307 169191 13 22 132114 2.2 6677 12680 365 132 132611 Indiana 139174 79419 137141 22 20 28987 1.0 8209 10887 19 30 29036 Iowa 55966 15014 54084 19 4 53650 3.5 27154 26681 55 26 53731 Kansas 54330 30767 52840 1 1 17558 1.3 7585 8363 27 30 17615 Kentucky 113149 64126 110981 3 4 24361 1.3 2033 5944 134 97 24592 Louisiana 97400 24962 95734 47 25 58027 3.1 43884 43744 47 14 58088 Maine 23770 2311 23094 2 4 21967 3.6 13264 13614 51 13 22031 Maryland 85317 42336 82921 21 28 47973 1.9 21506 19766 186 81 48240 Massachusetts 181423 32971 177712 64 45 183105 5.1 99978 105775 111 118 183334 Michigan 304335 176329 299598 89 152 88183 2.1 13108 17742 205 93 88481 Minnesota 109095 -6678 106027 31 22 160873 5.6 94086 105386 113 78 161064 Mississippi 32015 26496 31159 6 6 9581 0.9 2914 2385 65 16 9662 Missouri 104291 62045 101325 11 12 49470 1.8 27932 26378 95 29 49594 Montana 20763 5414 20062 40 11 19099 4.2 9281 9120 385 19 19503 Nebraska 24725 9025 24062 17 2 16641 1.7 11782 10578 20 7 16668 Nevada 71942 -20356 69929 7 4 58798 4.3 38976 40019 125 40 58963 New Hampshire 31378 1999 30945 13 10 27321 4.2 23297 23037 11 2 27334 New Jersey 206253 90438 199359 29 7 156181 3.9 50341 56157 227 260 156668 New Mexico 27849 9744 27018 2 2 20087 2.5 10799 10548 147 29 20263 New York 366595 286596 353586 33 21 314710 3.4 147496 166693 307 323 315340 North Carolina 172145 78062 169373 92 97 75220 1.7 54568 55442 120 114 75454 North Dakota 11818 6156 11552 16 6 8534 2.1 2365 3127 15 4 8553 Ohio 274288 77979 268091 44 163 214273 4.0 145950 152496 120 163 214556 Oklahoma 47744 25818 46038 45 22 25268 1.6 8414 11710 58 51 25377 Oregon 47498 17444 43332 26 9 63930 3.4 33407 34844 518 55 64503 Pennsylvania 404677 27226 394157 819 246 135708 2.3 7679 18556 498 190 136396 Puerto Rico 45394 25246 44246 11 1 19230 2.3 3991 3727 161 73 19464 Rhode Island 27800 -8047 27129 3 1 31847 6.7 20990 20821 19 6 31872 South Carolina 66475 34649 64667 18 25 30341 1.5 15230 16236 34 61 30436 South Dakota 6801 5040 6652 13 1 3538 0.8 864 616 40 3 3581 Tennessee 92500 54423 90015 66 36 37541 1.3 19191 19927 80 58 37679 Texas 276185 120759 263858 147 212 144697 1.2 18270 31058 396 939 146032 Utah 28532 8842 27677 41 12 24635 1.7 13809 14982 139 16 24790 Vermont 14633 10849 14236 1 1 13797 4.5 8987 8956 8 4 13809 Virgin Islands 250 127 225 0 0 512 1.5 -72 -84 10 0 522 Virginia 112497 66220 110423 24 24 41827 1.1 20199 21182 169 190 42186 Washington 182849 52940 177379 28 60 158025 4.7 95402 101690 453 454 158932 West Virginia 14523 10987 13876 4 9 21145 3.2 6991 9600 41 40 21226 Wisconsin 110934 59903 105256 20 14 99574 3.5 55967 59491 85 33 99692 Wyoming 6396 2743 6193 14 1 4519 1.7 1322 1733 61 5 4585 Totals 6015821 3095659 5832046 2451 1752 3416593 2.4 1341811 1508238 9378 5479 3431450
Figures appearing in columns showing over-the-week changes reflect all revisions in data for prior week submitted by state agencies.
1. The Unemployment Compensation program for Federal Employees (UCFE) and the Unemployment Compensation for Ex-servicemembers (UCX) exclude claims filed jointly under other programs to avoid duplication.
2. Rate is not seasonally adjusted. The source of U.S. total covered employment is BLS.
8
UNADJUSTED INITIAL CLAIMS FOR WEEK ENDED MARCH 28, 2020
STATES WITH AN INCREASE OF MORE THAN 1,000 State Change State Supplied Comment CA +871,992 Layoffs in the services industries. NY +286,596 Layoffs in the accommodation and food services, retail trade, and health care and social assistance industries. Increase in initial claims due to COVID-19. MI +176,329 Layoffs in the manufacturing, construction, retail trade, administrative, support, waste management, and remediation services, and health care and social assistance industries. FL +154,171 Layoffs in the agriculture, forestry, fishing, and hunting, construction, manufacturing, wholesale trade, retail trade, and other services industries. GA +121,680 No comment. TX +120,759 Layoffs in the accommodation and food services, manufacturing, other services, health care and social assistance, administrative, support, waste management, and remediation services, professional, scientific, and technical services, arts, entertainment, and recreation, information, mining, agriculture, forestry, fishing, and hunting, retail trade, real estate rental and leasing, construction, transportation and warehousing, and management of companies and enterprises industries. NJ +90,438 Increase in initial claims due to COVID-19. IN +79,419 Layoffs in the manufacturing, arts, entertainment, and recreation, and accommodation and food services industries. Increase in initial claims due to COVID-19. NC +78,062 Layoffs in the health care and social assistance, administrative, support, waste management, and remediation services, accommodation and food services, and other services industries. OH +77,979 Increase in initial claims due to COVID-19. AL +70,092 Layoffs in the accommodation and food services, health care and social assistance, manufacturing, administrative, support, waste management, and remediation services, professional, scientific, and technical services, arts, entertainment, and recreation, educational services, and construction industries. Increase in initial claims due to COVID-19. VA +66,220 Layoffs in the manufacturing industry. IL +64,307 Layoffs in the other services, accommodation and food services, and retail trade industries. KY +64,126 No comment. MO +62,045 Layoffs in the manufacturing, retail trade, arts, entertainment, and recreation, and health care and social assistance industries. Increase in initial claims due to COVID-19. WI +59,903 Layoffs in the manufacturing and retail trade industries. Increase in initial claims due to COVID-19. AZ +59,592 No comment. TN +54,423 Layoffs in the accommodation and food services, retail trade, health care and social assistance, transportation and warehousing, and administrative, support, waste management, and remediation services industries. WA +52,940 Layoffs in the accommodation and food services industry. MD +42,336 No comments. CO +42,064 Layoffs in the arts, entertainment, and recreation, accommodation and food services, and other services industries. Increase in initial claims due to COVID-19. HI +39,779 Increase in initial claims due to COVID-19. SC +34,649 No comment. MA +32,971 Increase in initial claims due to COVID-19. KS +30,767 No comment. PA +27,226 Layoffs in the construction, administrative, support, waste management, and remediation services, and accommodation and food services industries. MS +26,496 Increase in initial claims due to COVID-19. OK +25,818 No comment. PR +25,246 Increase in initial claims due to COVID-19. LA +24,962 No comment. ID +19,355 Increase in initial claims due to COVID-19. AR +18,481 No comment. OR +17,444 No comment.
9
IA +15,014 Layoffs in the accommodation and food services, health care and social assistance, other services, educational services, administrative, support, waste management, and remediation services, and construction industries. Increase in initial claims due to COVID-19. WV +10,987 No comment. VT +10,849 Increase in initial claims due to COVID-19. NM +9,744 Layoffs in the accommodation and food services, health care and social assistance, retail trade, administrative, support, waste management, and remediation services, other services, arts, entertainment, and recreation, manufacturing, information, and educational services industries. Increase in initial claims due to COVID-19. NE +9,025 Increase in initial claims due to COVID-19. UT +8,842 No comment. DE +8,361 No comment. CT +8,127 Layoffs in the educational services and other services industries. Increase in initial claims due to COVID-19. ND +6,156 Increase in initial claims due to COVID-19. AK +5,927 No comment. MT +5,414 Layoffs in the retail trade and accommodation and food services industries. Increase in initial claims due to COVID-19. SD +5,040 Increase in initial claims due to COVID-19. WY +2,743 Layoffs in the accommodation and food services, health care and social assistance, construction, mining, and retail trade industries. Increase in initial claims due to COVID-19. ME +2,311 Layoffs in the accommodation and food services, health care and social assistance, retail trade, manufacturing, arts, entertainment, and recreation, other services, administrative, support, waste management, and remediation services, educational services, construction, and wholesale trade industries. Increase in initial claims due to COVID-19. NH +1,999 Increase in initial claims due to COVID-19. DC +1,407 Increase in initial claims due to COVID-19.
STATES WITH A DECREASE OF MORE THAN 1,000 State Change State Supplied Comment NV -20,356 No comment. RI -8,047 No comment. MN -6,678 No comment.
TECHNICAL NOTES
This news release presents the weekly unemployment insurance (UI) claims reported by each state’s unemployment insurance program offices. These claims may be used for monitoring workload volume, assessing state program operations and for assessing labor market conditions. States initially report claims directly taken by the state liable for the benefit payments, regardless of where the claimant who filed the claim resided. These are the basis for the advance initial claims and continued claims reported each week. These data come from ETA 538, Advance Weekly Initial and Continued Claims Report. The following week initial claims and continued claims are revised based on a second reporting by states that reflect the claimants by state of residence. These data come from the ETA 539, Weekly Claims and Extended Benefits Trigger Data Report.
A. Initial Claims
An initial claim is a claim filed by an unemployed individual after a separation from an employer. The claimant requests a determination of basic eligibility for the UI program. When an initial claim is filed with a state, certain programmatic activities take place and these result in activity counts including the count of initial claims. The count of U.S. initial claims for unemployment insurance is a leading economic indicator because it is an indication of emerging labor market conditions in the country. However, these are weekly administrative data which are difficult to seasonally adjust, making the series subject to some volatility.
B. Continued Weeks Claimed
A person who has already filed an initial claim and who has experienced a week of unemployment then files a continued claim to claim benefits for that week of unemployment. Continued claims are also referred to as insured unemployment. The count of U.S. continued weeks claimed is also a good indicator of labor market conditions. Continued claims reflect the current number of insured unemployed workers filing for UI benefits in the nation. While continued claims are not a leading indicator (they roughly coincide with economic cycles at their peaks and lag at cycle troughs), they provide confirming evidence of the direction of the U.S. economy.
C. Seasonal Adjustments and Annual Revisions
Over the course of a year, the weekly changes in the levels of initial claims and continued claims undergo regularly occurring fluctuations. These fluctuations may result from seasonal changes in weather, major holidays, the opening and closing of schools, or other similar events. Because these seasonal events follow a more or less regular pattern each year, their influence on the level of a series can be tempered by adjusting for regular seasonal variation. These adjustments make trend and cycle developments easier to spot. At the beginning of each calendar year, the Bureau of Labor Statistics provides the Employment and Training Administration (ETA) with a set of seasonal factors to apply to the unadjusted data during that year. Concurrent with the implementation and release of the new seasonal factors, ETA incorporates revisions to the UI claims historical series caused by updates to the unadjusted data.
Weekly Claims Archives Weekly Claims Data
U.S. Department of Labor news materials are accessible at http://www.dol.gov. The Department’s Reasonable Accommodation Resource Center converts Departmental information and documents into alternative formats, which include Braille and large print. For alternative format requests, please contact the Department at (202) 693-7828 (voice) or (800) 877-8339 (federal relay).
U.S. Department of Labor Employment and Training Administration Washington, D.C. 20210 Release Number: USDL 20-592-NAT Program Contacts: Kevin Stapleton: (202) 693-3009 Media Contact: (202) 693-4676
Jobless Claims Drop 261,000 to 6,606,000 from Last Week’s 6,867,000 added by admin on
View all posts by admin →